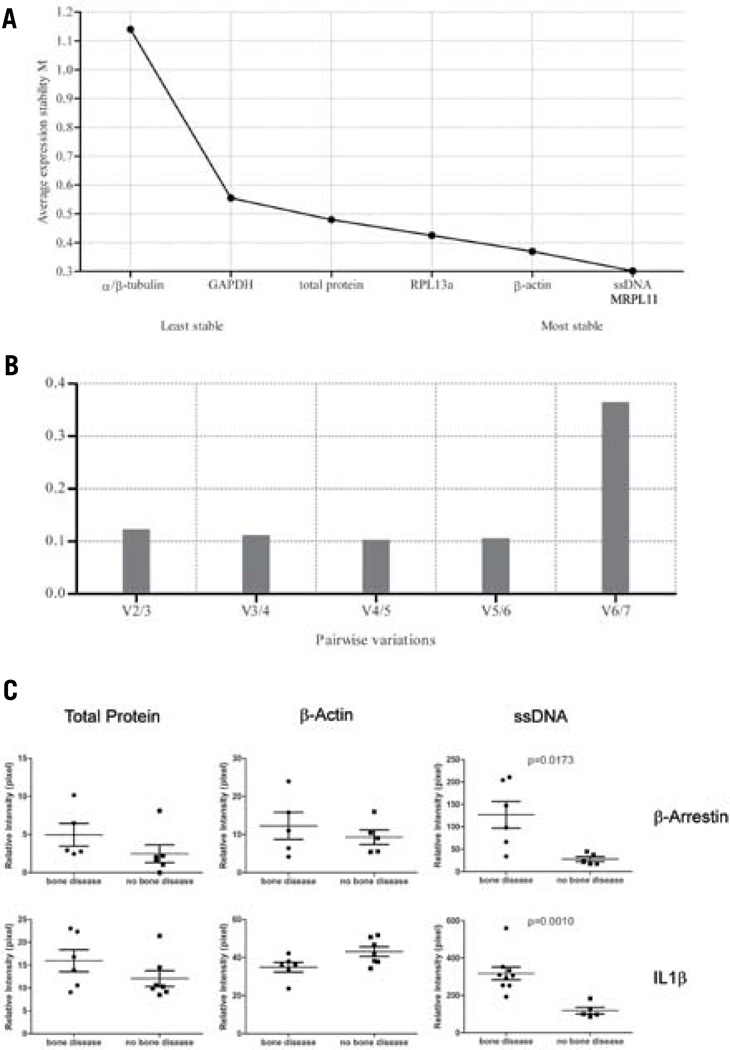
Figure 3. geNorm and NormFinder algorithms are suitable for finding a normalization analyte for RPMAs.
(A) An example of protein expression stability ranking of the seven normalization analytes in a group of bone metastasis specimens. A lower rank indicates a more stable analyte, while a higher rank indicates a less stable analyte. (B) An example of pairwise variation analysis to determine the least number of analytes required for data normalization. The shortest column indicates the optimal number of analytes to use for normalization. Any column less than 1.5 indicates a number of analytes sufficient for reliable normalization. (C) Bone marrow core biopsy sample data normalized using three different methods—total protein, β-actin, and ssDNA—for two different proteins, β-arrestin and IL1β. ssDNA normalization in each case demonstrated better discrimination between the bone disease group and the no bone disease group, compared with total protein or β-actin normalization (Mann-Whitney t-test: β-arrestin, P = 0.0173; IL1β, P = 0.0010).

