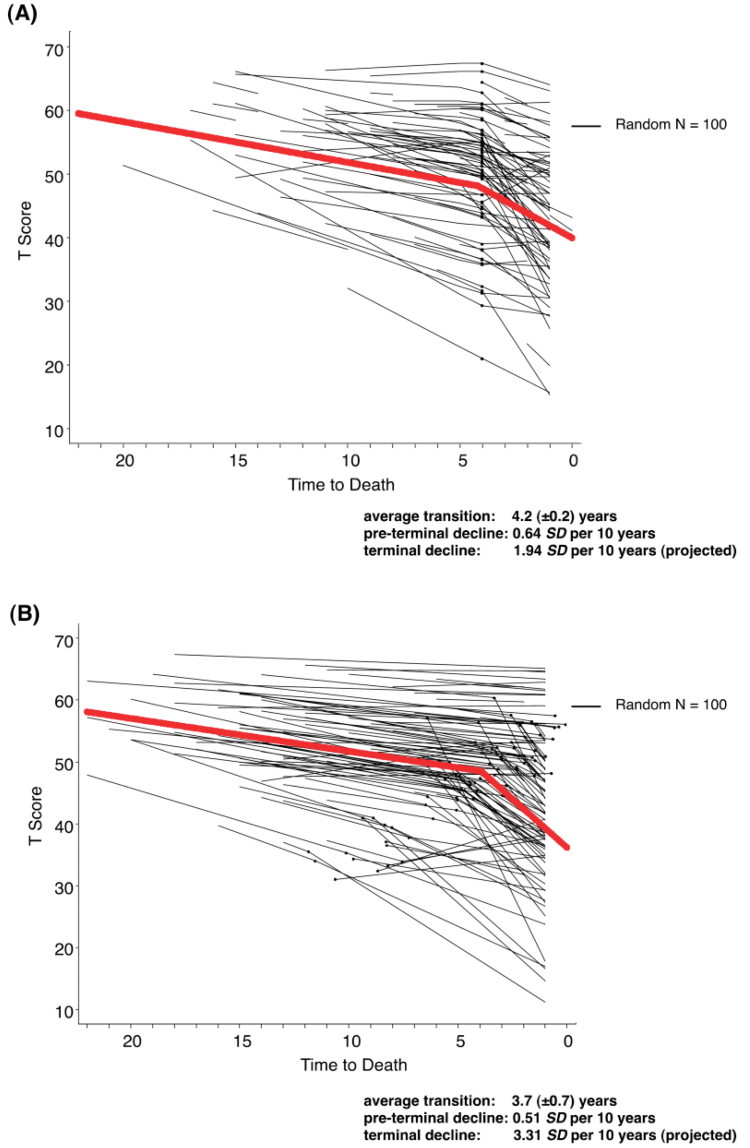
Figure 2.
Individual (thin lines; random selection of n = 100) and typical (thick lines) late-life trajectories of change for the well-being indicator of life satisfaction, as obtained from now-deceased participants in the Socio-Economic Panel. Results are shown from multi-phase models make the assumption that all individuals enter the terminal phase at exactly the same point in time (Panel A) or relax the assumption (Panel B). Although the average onset of decline is comparable, Panel B illustrates that some people entered the terminal phase earlier (e.g., some seven or eight years before death), whereas others entered later (e.g., some two or three years before death), and still others did not ever enter terminal decline. For details, see Figures 1 and 2 in Gerstorf et al., 2008.

