
Figure 3.
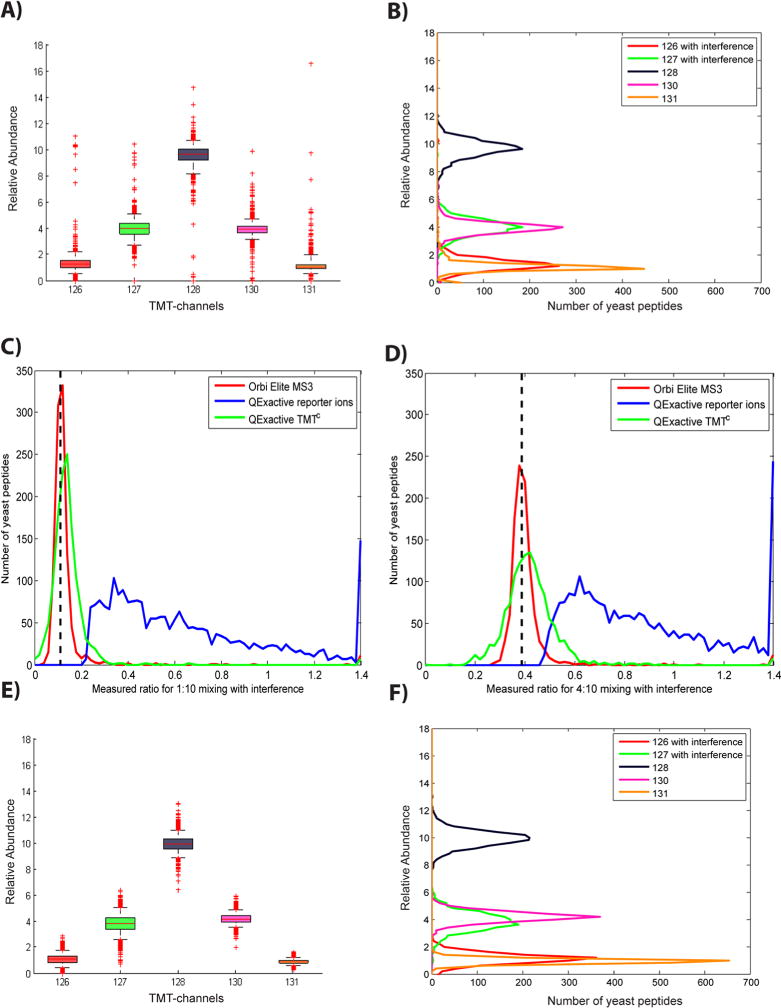
Large-scale evaluation of TMTC quantification. Panels A–D show yeast peptide ratios from the two-proteome human–yeast sample based on data acquired on a QExactive mass spectrometer. (A) Boxplot showing yeast peptide ratios determined using TMTC quantification (ratios are normalized to 20). Whiskers reach from the 5th to the 95th percentile. The median and numbers of outliers for channels with interference (126, 127) are very similar to equivalent channels without interference (130, 131). (B) Frequency distributions for ratios in panel A. Although interference does not seem to cause systematic errors, the ratio distribution for channels with interfering ions is wider than that for channels without interference. (C and D) Yeast peptides mixed in the ratios of 1:10 (TMT-126/TMT-128) and 4:10 (TMT-127/TMT-128), respectively, and subjected to interference by human peptides were quantified using TMT reporter ions (blue) or the TMTC approach (green). For evaluation, the same sample was also analyzed with an additional gas-phase isolation step (MS3) on an Orbitrap Elite (red). (E) Boxplot of Monte Carlo simulated yeast peptide ratios. The TMTC envelopes were simulated based on the known mixing ratios. As expected, the most striking difference to the actual experiment in panel A is the absence of extreme outliers. (F) Frequency distribution as in panel B of Monte Carlo simulated yeast peptide ratios. Although the extreme outliers are missing in the simulation the overall distribution is remarkably similar. As the simulation does not consider interfering peptides the wider distribution observed in the channels with interference is likely due to the increased overlap of the ion clusters with TMTC ions from other channels (see also Supporting Information Figure 4).