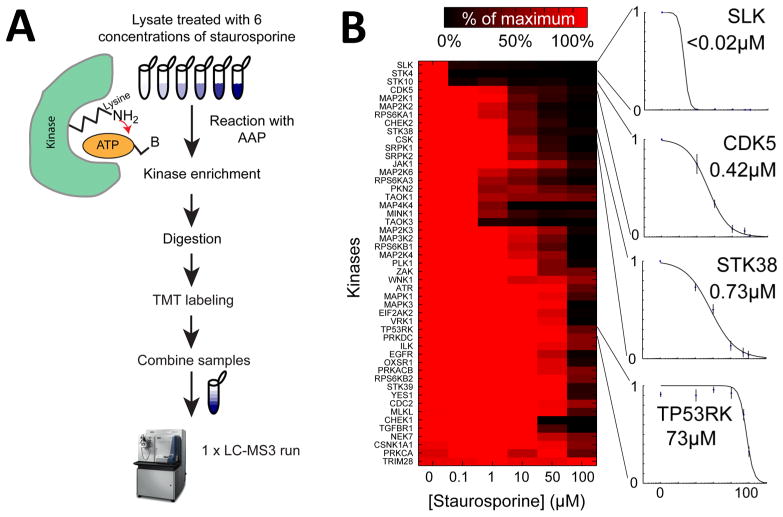
Figure 1.
Combining TMT with ATP probes for the accurate quantitation of kinases inhibitor profiling. (A) HeLa lysate was treated with six concentrations of staurosporine ranging from 0 to 100 μM followed by incubation with AAPs to label kinases and ATPases with desthiobiotin. Following streptavidin capture at the protein level, the proteins were digested and labeled with TMT before being combined into a single sample for analysis with LC–MS3. (B) Heat map of staurosporine inhibition in HeLa lysate, normalized to the kinase abundance in the maximum sample and clustered hierarchically using euclidean distance to group similar responders. Dose-dependent inhibition plots show profiles for various kinases. The data are shown as averages of the peptides quantitated for each of the kinases ± SD.

