
Figure 3.
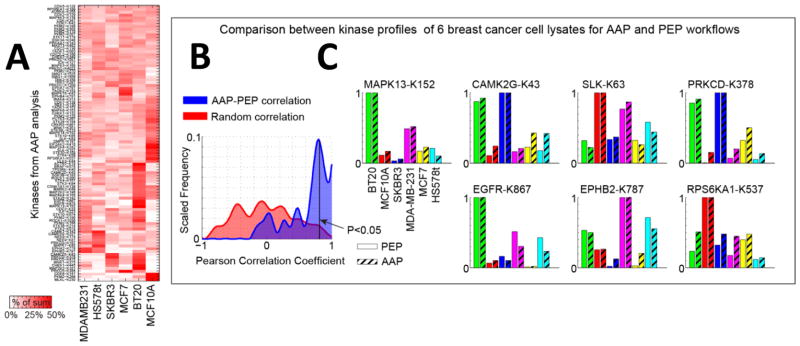
ATP probes in general do not appear to preferentially bind to the active form of a kinase. (A) Kinase profiles from AAP (peptide-level capture workflow) with TMT quantitation in six cell lysates in a single LC–MS3 run. The heat map represents the kinase intensities normalized to the sum of intensities across the six cell lines. Hierarchical clustering with euclidean distance groups similar responders together. A larger version of this heat map is shown in Supporting Information Figure S2. (B) Pearson correlation between the kinase profiles in the six lysates for AAP and PEP indicates a high degree of correlation between the two experiments (blue), as compared to the correlation obtained by randomly permuting the data (red). (C) Individual bar charts for kinase profiles for AAP and PEP workflows. The K indicates the modified lysine site to which the probe was attached.