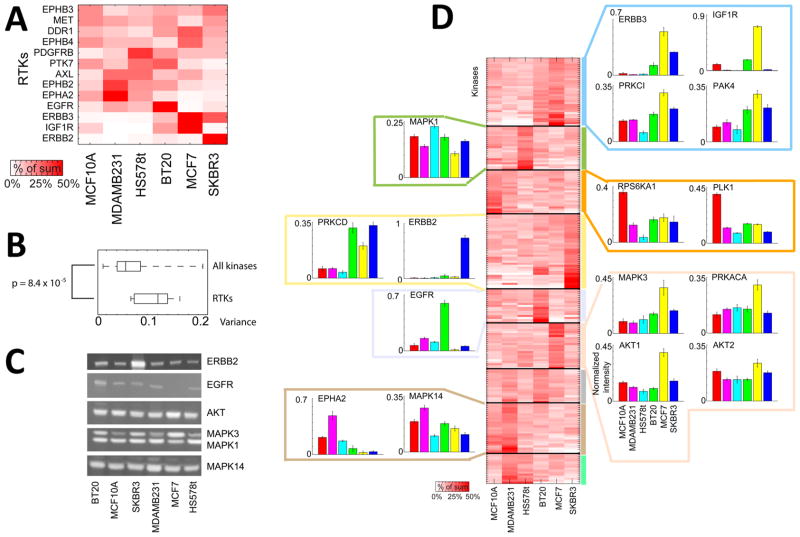
Figure 5.
Comparison of kinase expression differences across six breast cancer cell lines. PEP on six cell lysates resulted in the quantitation of 212 kinases. (A) The heat map displays receptor tyrosine kinases (RTKs) normalized to the sum of the TMT channel intensities across all six channels. (B) A box and whisker plot illustrates the larger variance of the RTKs in the six cell lines compared to the other kinases. The p-value was determined from a Mann–Whitney U test. (C) Western blots for the indicated kinases. (D) Unsupervised K-means clustering using all kinases identified from PEP. Kinases are normalized to the sum of the TMT intensity across all the cell lines for each kinase. Individual bar charts illustrate the profiles for various kinases. The data are shown as averages of the peptides quantitated for each of the kinases ± SD.

