
Figure 3. Endogenous YY1 interacts with Trim28 and mediates deposition of chromatin and DNA methylation marks.
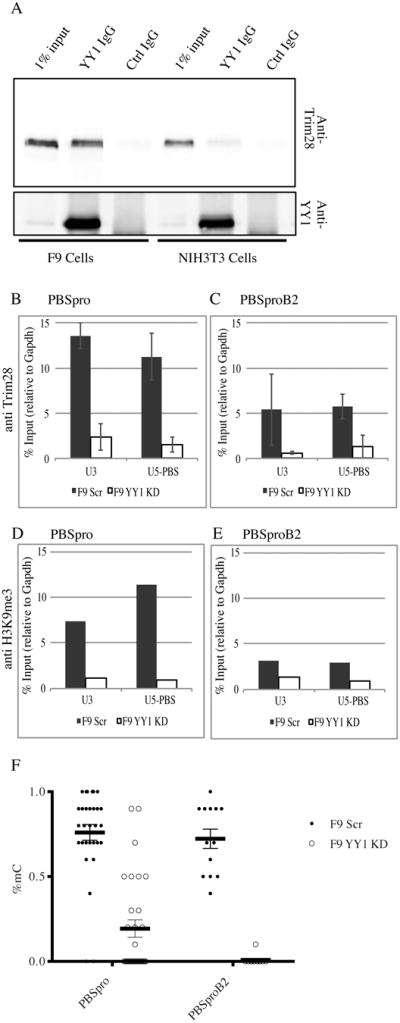
(A) Anti-YY1 immunoprecipitates from F9 and NIH3T3 nuclear extracts were analyzed by Western blot analysis with anti-Trim28 and anti-YY1 antibodies as indicated. Total proteins from 1% of the input to the immunoprecipitates are shown for comparison (for quantification see Fig S3D). (B, C) ChIP–based measurement of Trim28 at the viral U3 and U5-PBS regions on F9 YY1 KD cells and control F9 scrambled KD cells infected with MLV vectors containing either wt PBSpro or mutant PBSproB2 at 4 days after infection. The graphs show the mean enrichment ± SEM from 4 independent experiments relative to the total input samples and normalized to the signal of negative control (Gapdh). (D, E) ChIP assay for H3K9me3 on PBSpro or PBSproB2 vectors at 4 days after infection. All graphs show enrichment values relative to the total input samples and normalized to the signal of negative control (Gapdh). One experiment out of two is shown. (F) Bisulfite sequencing analysis of the 5′LTR of the infecting virus was performed on F9 YY1 KD pool and control F9 scrambled KD pool; percentages of methylated CpGs are shown for 10 to 20 cloned DNA molecules per cell and infection type (see Fig S4 for PBSpro data). Statistical significance determined using the HolmSidak method, with alpha=5.000%.