
Figure 2.
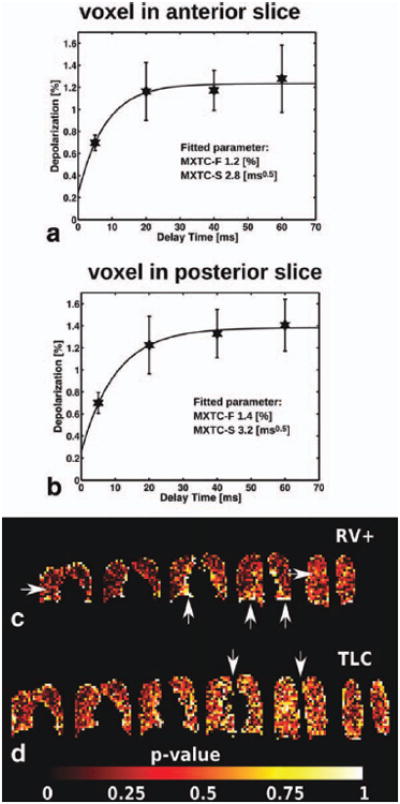
Fits of the signal-intensity data from two individual voxels (a, b) and p-value maps illustrating the quality of fit (c, d). Voxel fits, from subject H3 at low ventilation volume (RV+: xenon-oxygen-air mixture inhaled from RV), showed an elevated time constant (related to MXTC-S) and elevated maximum depolarization value (related to MXTC-F) in posterior slice (b) compared to anterior slice (a). Error bars correspond to the standard deviation of the depolarization values in the respective image slice. The location of the voxel fits shown in (a) and (b) is indicated in (c) by arrows. The quality of fit (volunteer H3) is illustrated for each imaging voxel by a p-value calculated from the χ2 -distribution of the weighted fit result (c, d). For p > 0.95, the null hypothesis, i.e. no significant difference between expected and observed result exists, was rejected and the fitted parameters for the particular voxel were flagged as invalid. The map shows regions of low fit quality (high p-value) around the edges of the lung and around the heart, possibly secondary to motion. During the TLC experiment (d), SNR was lower resulting in overall decreased fit quality, especially at the center images since the sensitivity of the surface coil receivers decreases with distance from the coils. The five (c) and six (d) coronal image partitions are the center partitions out of a total of eight partitions acquired, covering the entire lung volume.