
Figure 3.
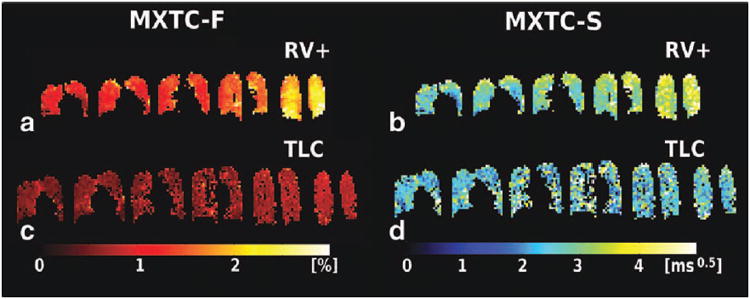
Parameter maps for tissue- to alveolar-volume ratio parameter MXTC-F, and septal-wall thickness parameter MXTC-S, obtained from curve fitting (volunteer H3). (a, b) At low lung inflation (labeled RV+), elevated parameter values were found in dependent lung regions (posterior images, to the right). (c, d) At high lung inflation (TLC), parameter values were generally lower and appeared fairly homogeneous throughout the lung.