
Figure 7.
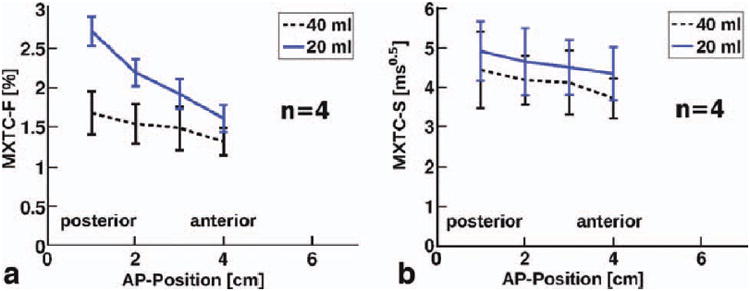
Median parameter values for each slice as a function of AP-position for four rabbits. (a) MXTC-F and (b) MXTC-S (b) at low lung inflation (20 ml) are shown in blue and at high lung inflation (40 ml) are shown in black. Error bars indicate the standard deviations of the data from the four rabbits. Similar to the human results, an AP-gradient for MXTC-F was pronounced at low lung inflation. In contrast, for MXTC-S, a statistically-significant volume dependence of the gradient was not found. However, especially for MXTC-S, the differences among the rabbits were relatively large, as indicated by the error bars.