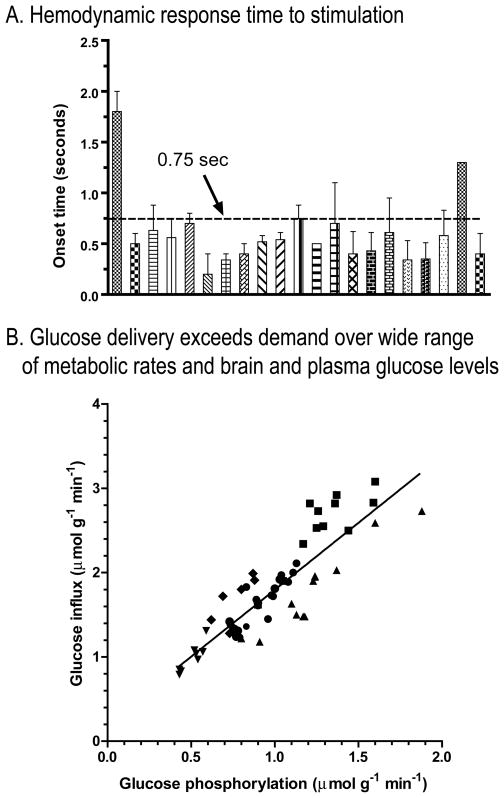
Figure 4. Fuel delivery to activated brain is quickly upregulated and exceeds demand. (A).
Hemodynamic responses include blood volume, blood flow, and blood oxygen level-dependent (BOLD) signal. Data obtained in studies in anesthetized subjects are plotted from studies summarized in Table 1 of (Masamoto and Kanno, 2012). Note the onset time is <0.75s in most studies. (B) Comparison of paired glucose delivery and phosphorylation rates determined in the same tissue sample. Samples were derived from rats assayed under different experimental conditions designed to vary blood and brain glucose levels and brain glucose utilization rates over a wide range. Data are from (Cremer et al., 1983; Hargreaves et al., 1986). The regression line is y = 1.59x + 0.21 (r2 = 0.77). Modified from Fig. 3 of (Dienel, 2012b) with permission of the author.

