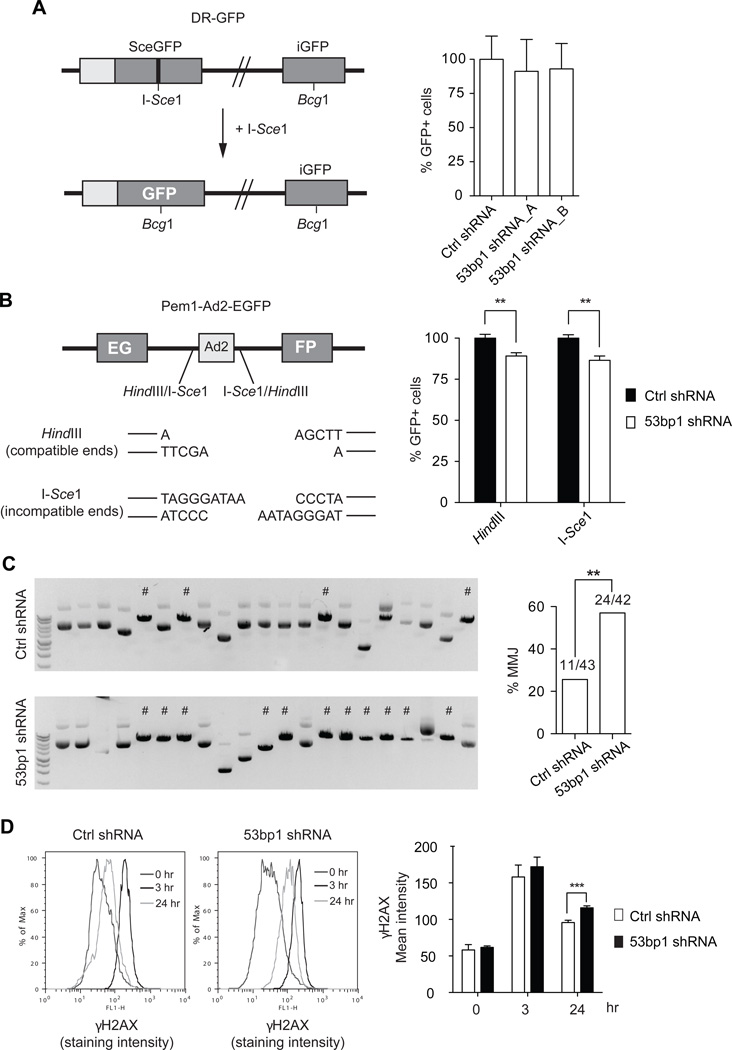
Figure 5. 53BP1 is required for an efficient NHEJ, while represses alternative-NHEJ.
(A) Left panel: schematic representation of the DR-GFP construct and assay used to measure HR efficiency (see text for details). Right panel: graph showing HR analysis performed in U251 cells transduced with the indicated shRNAs. Data are presented as mean±SD of 3 independent experiments. (B) Left panel: schematic representation of the Pem1-Ad2-EGFP construct and assay used to measure NHEJ efficiency (see text for details). Right panel: graph showing NHEJ analysis results, performed in U251 cells transduced with ctrl shRNA or 53bp1 shRNA_A and with the Pem1-Ad2-EGFP previously linearized in vitro with either HindIII or I-SceI enzymes. Data are presented as mean±SD of 3 independent experiments, each done in either duplicate or triplicate; t-test: **p<0.005. (C) Left panels: Representative ethidium bromide stained agarose gels showing HindIII digestion products on the recovered plasmids from the NHEJ assay in (B). # indicate microhomology-mediated junctions (MMJ) events. Right panel: graph showing the percentage of MMJ in ctrl shRNA and 53bp1 shRNA U251 cells; Fisher’s exact test: **p=0.0042. (D) DNA damage measured by γH2AX staining and analysis by flowcytometry, of U251 cells after exposure to IR. Left panel: Representative γH2AX staining intensity distribution. Right panel: graph of γH2AX mean intensity. Data are presented as mean±SD of 3 independent experiments, each performed in either duplicate or triplicate; t-test: ***p=0.0005.

