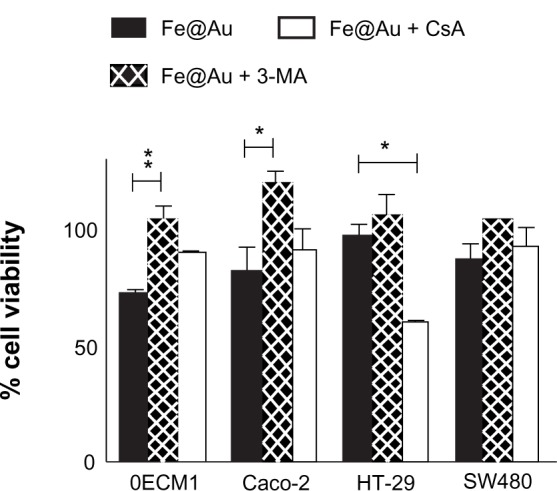
Figure 7.

Bar graph illustrating the overall viability of Fe@Au-treated cancer cells, and the influence of the mitochondrial membrane potential blocker CsA and the autophagy inhibitor 3-MA.
Notes: WST-1 cell viability analysis was performed after 48 hours with the assigned treatment; ie, either in the presence with 5 μM CsA or 10 mM 3-MA. The cell viability of Fe@Au + CsA and Fe@Au + 3-MA was calculated according to the matching control conditions of CsA alone and 3-MA alone. *P & 0.05; **P & 0.01; t-test.
Abbreviations: Fe, iron; Au, gold; CsA, cyclosporin A; 3-MA, 3-methyladenine; WST-1, water-soluble tetrazolium salt.
