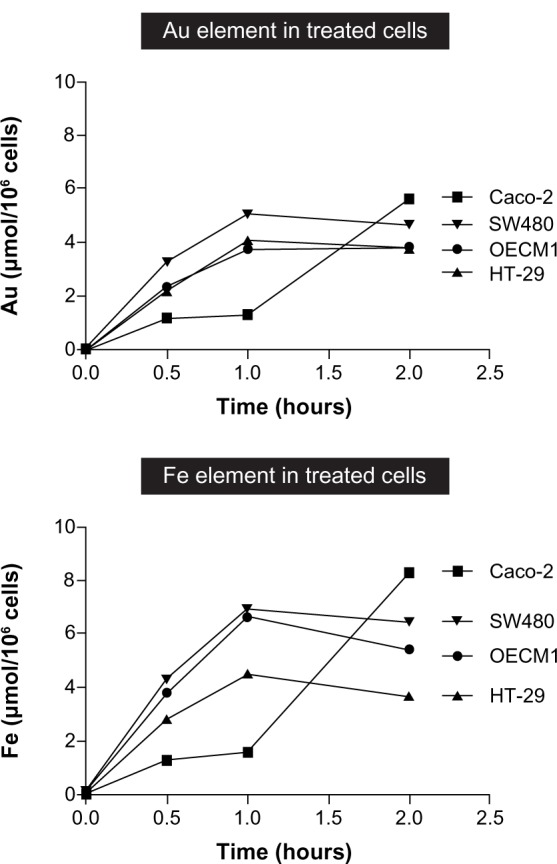
Figure 8.

Line graph summarizes the internalization profiles of Fe@Au nanoparticles as assessed by ICP-OES.
Notes: Cells were treated with 50 μg/mL of Fe@Au for the assigned times; the cells were harvested; and the Fe and Au concentration was analyzed. From this graph, it becomes clear that the total amount of internalized Fe or Au is not proportional to the cytotoxicity observed in individual cells.
Abbreviations: ICP-OES, inductively coupled plasma optical emission spectrometry; Fe, iron; Au, gold.
