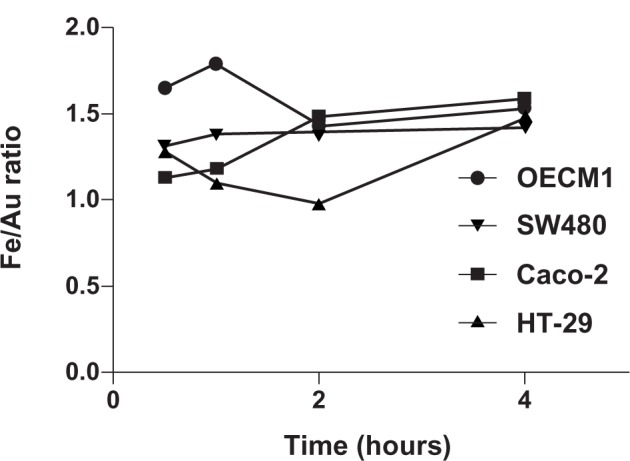
Figure 9.

The ratio of internalized Fe and Au elements was explored at different times.
Notes: The molar ratio of Fe to Au is used as an index of internalized elements. In the early time points (30 minutes and 1 hour), the OECM1 cells show the highest Fe:Au ratio. Interestingly, the Fe:Au ratio in HT-29 cells is significantly lower than in OECM1 cells (P = 0.0210; t-test), which correlates with HT-29 cells’ extreme resistance to Fe@Au treatment (Figure 1).
Abbreviations: Fe, iron; Au, gold.
