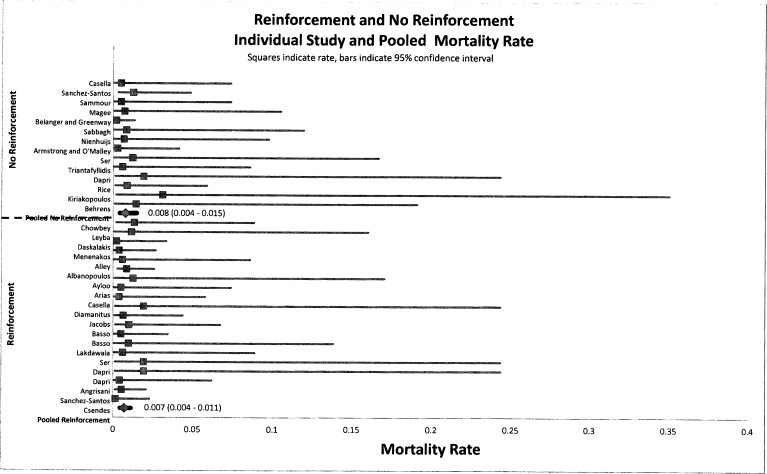
Figure 3.
Forest plot of pooled event rates of odds ratios for mortality rates of group A (reinforced) and group B (non-reinforced) for each article. The squares indicate the event rates, and the lines indicate the extent of the 95% CI. Summative pooled event rates are shown with 95% CIs in parentheses.

