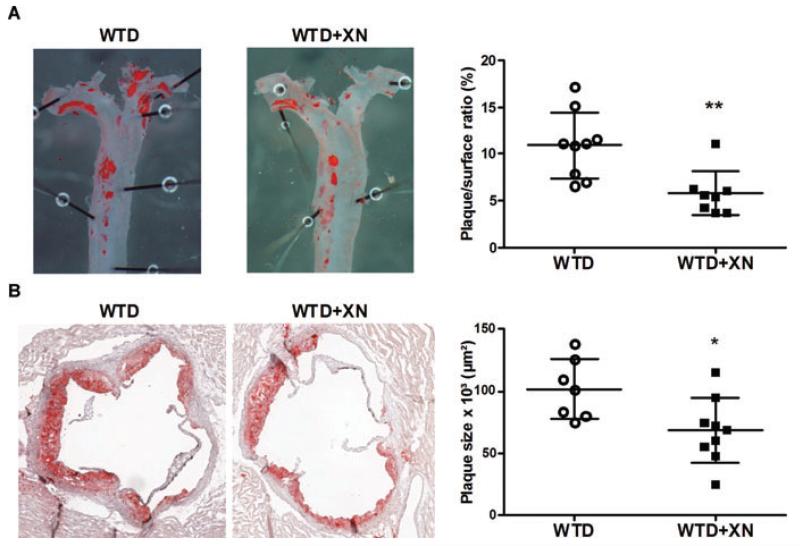
Figure 1.
Reduced plaque formation in XN-fed ApoE−/− mice. Female ApoE−/− mice were fed WTD ± XN for 8 weeks. (A) Representative images of the descending thoracic aorta. The graph represents mean lesion area relative to the total surface area. **p ≤ 0.01. (B) Representative images of aortic valve sections. The graph represents mean plaque area calculated from five consecutive sections per mouse. Bars represent the mean values of eight to nine animals ±SD. *p < 0.05.

