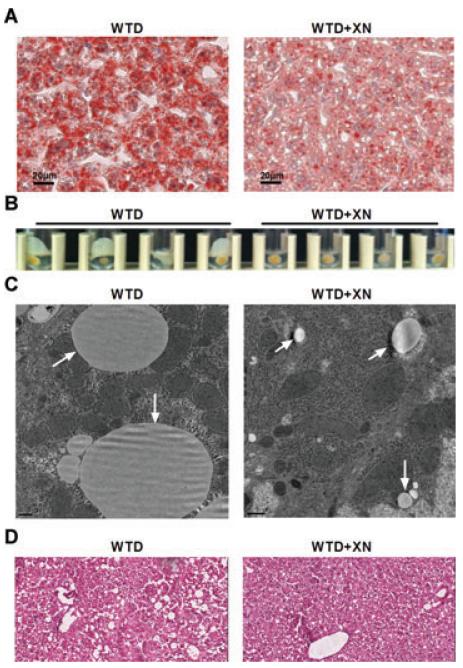
Figure 4.
Reduced lipid content in livers of XN-fed ApoE−/− mice. Female ApoE−/− mice were fed WTD ± XN for 8 weeks. (A) Representative images of oil red O-stained liver sections. (B) Fat layers after separation of lipids from water soluble components by ultracentrifugation at 100 000 × g for 60 min at 4°C. (C) Representative electron microscopy images showing lipid droplets in hepatocytes indicated by white arrows. (D) Representative images of hematoxylin/eosin staining.

