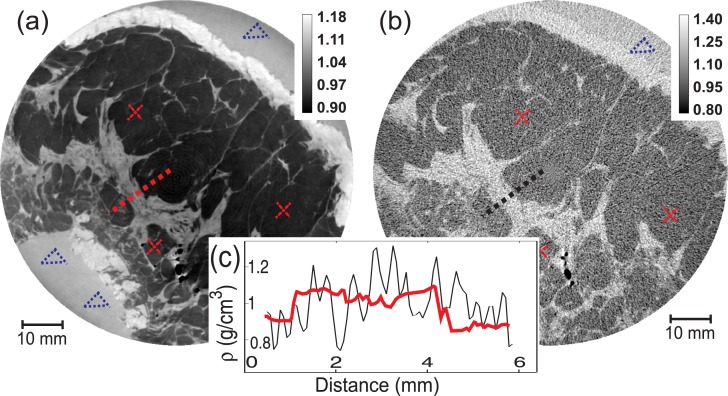
Fig. 2.
Distribution of the material density in a slice of the examined sample obtained using (a) refraction CT and (b) absorption CT. Darkest gray levels correspond to the fat tissue, brightest to the skin, intermediate gray values show other anatomical features. The group of black spots are air bubbles trapped inside the tissues. The unit of the colorbar values is g/cm3. To derive the density of the different materials several regions of an image were considered as it shown, for example, by triangles (formalin samples), and crosses (adipose tissue samples). In the inset (c), the 1D density profiles at the adipose-glandular-adipose tissue interfaces [indicated by dashed lines in (a) and (b)] for RCT and ACT correspondingly, are shown.

