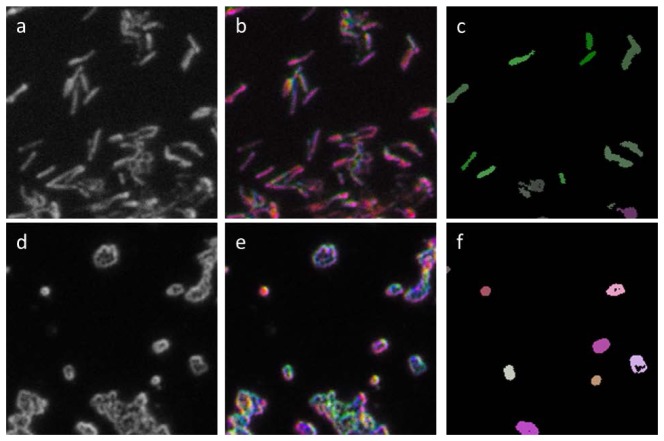
Fig. 3.
Sample MARDI images of M. smegmatis (a-c) and S. aureus (d-f). (a) and (d) show a portion of a single channel without post processing. Each frame is 80x80 µm. (b) and (e) show the same frames colored by assigning RGB values to pixel-by-pixel PCA score for three modes. (c) and (f) show the same field as (a) and (d), respectively, with object identification and summing prior to PCA. RGB values are assigned to three PCA mode scores. In all cases mode scores were chosen to maximize the visible difference between species.

