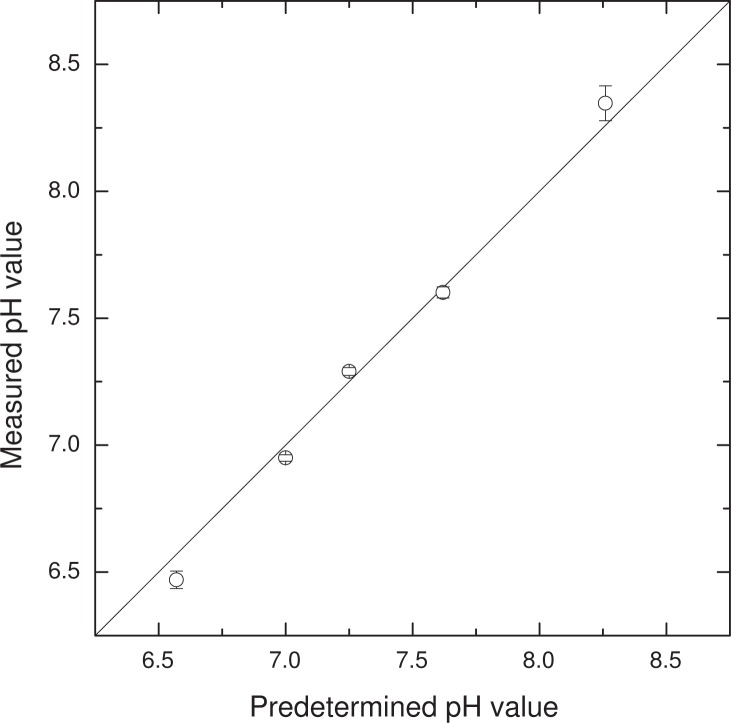
Fig. 3.
pH values determined with optical absorption measurements, against pre-calibrated values. Error bars represent the standard deviation of 108 individual measurements (12 chambers, 9 individual measurements taken at time intervals of several minutes). The standard deviation and absolute error are also shown in Fig. 4.

