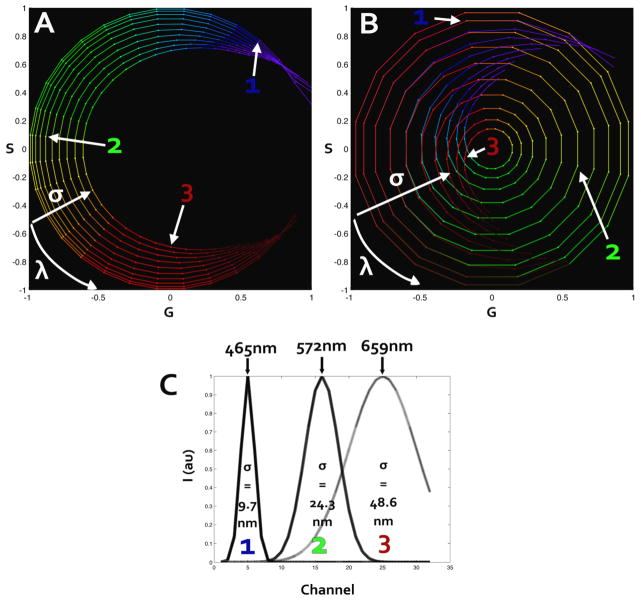
Figure 1.
First harmonic (A) and second harmonic (B) spectral phasor. The dataset used was simulated using 32 wavelength channels and a Gaussian spectrum changing both in position and width. Color coding is representative of the corresponding wavelength. Panel (C) represents three of the simulated spectra used for calculating (A) and (B). The corresponding points in spectral phasor plot are marked both in first and second harmonic. The change in wavelength peak changes the position counterclockwise on the spectral plot. An increase in the width of the spectrum will shift the point toward the origin of the axes.

