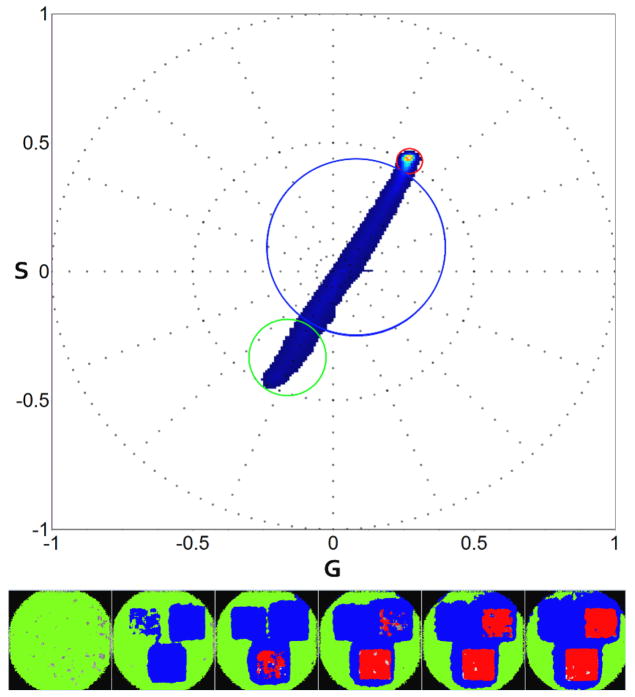
Figure 6.
KikGR green to red photo-activation second harmonic spectral phasor analysis (top). Three ROIs are selected on the bead yielding 65×68 pixels. Laser power at 405nm is set respectively at 0.04 μW (left ROI), 1.33 μW (right ROI) and 2.69 μW (bottom ROI) for the ROIs. Zoom is set at 2.0 with a frame size of 66.10um ×66.10um. 50 frames are acquired using 488nm and 561nm wavelength. Green cursor on spectral phasor plot (top) is used to select the green state, red cursor for red state. Blue selection outlines the linear combination between green and red. Corresponding frame pixels are colored according to the cursor color (bottom). For clarity we show 6 out of 50 frames acquired.

