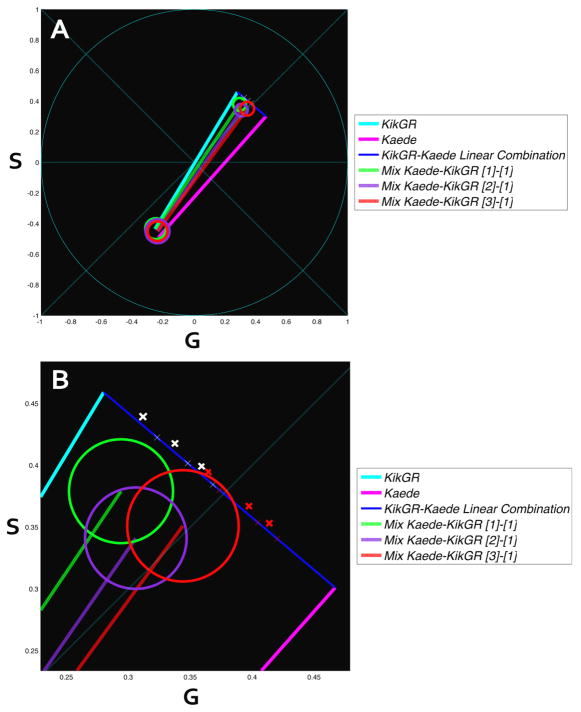
Figure 8.
Second harmonic representation of three mixed samples Kaede-KikGR with concentration ratio 1:1 (green), 2:1 (purple) and 3:1 (red). Three sets of images were acquired using 488nm and 561nm laser lines. Each set has had selection of 3 ROIs yielding approximately 63×61 pixels. 50 images per sample were used for analysis. Cursors were placed selecting at least 90% of the pixels belonging to the specific state. KikGR (light blue) and Kaede (violet) are represented (A). in B We show a magnification of the A plot. Linear combination of red Kaede (violet) and KikGR (light blue) of mixtures with relative brightness of 1 (red crosses) are shown in the line connecting the phasor of Kaede and KikGR. The measured intersections are shown in the white crosses on the same lines.

