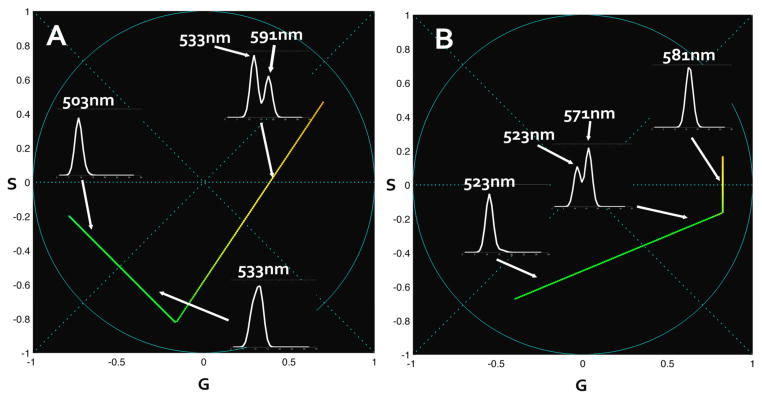
Figure 9.

Second harmonic spectral phasor of intermediate-state simulated data. In these simulations we consider 100% conversion and an obligatory conversion to intermediate state before reaching the final wavelength. Two sets are represented. First set (A) shows a first state at 503nm, intermediate at 533nm and activated at 591nm. Second set (B) shows an initial state at 523nm, intermediate state at 571nm and final state at 581nm. Spectra plot are reported on the image with an arrow indicating the corresponding position on the spectral phasor plot. Colorscale in use associates the real color to the wavelength.
