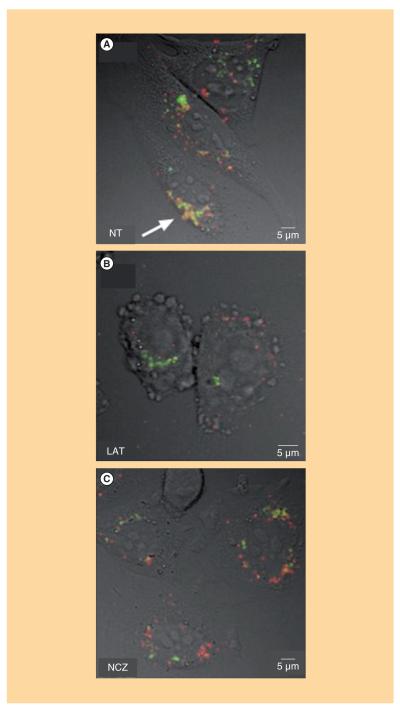
Figure 3. Representative overlays of fluorescence and Nomarski images of (A) non-, (B) latrunculin B- and (C) nocodazole-treated cells.
A qualitative co-localization was obtained simply overlaying pixel-by-pixel different channels, pseudo-colored using red and green look-up tables. We used green for LysoSensor-labeled lysosomes while red for Cy3-labeled lipoplexes. The presence of the two fluorescent labels in the same pixels (i.e., co-localization) produces yellow hotspots (indicated by white arrows).
LAT: Latrunculin B; NCZ: Nocodazole; NT: Not treated.

