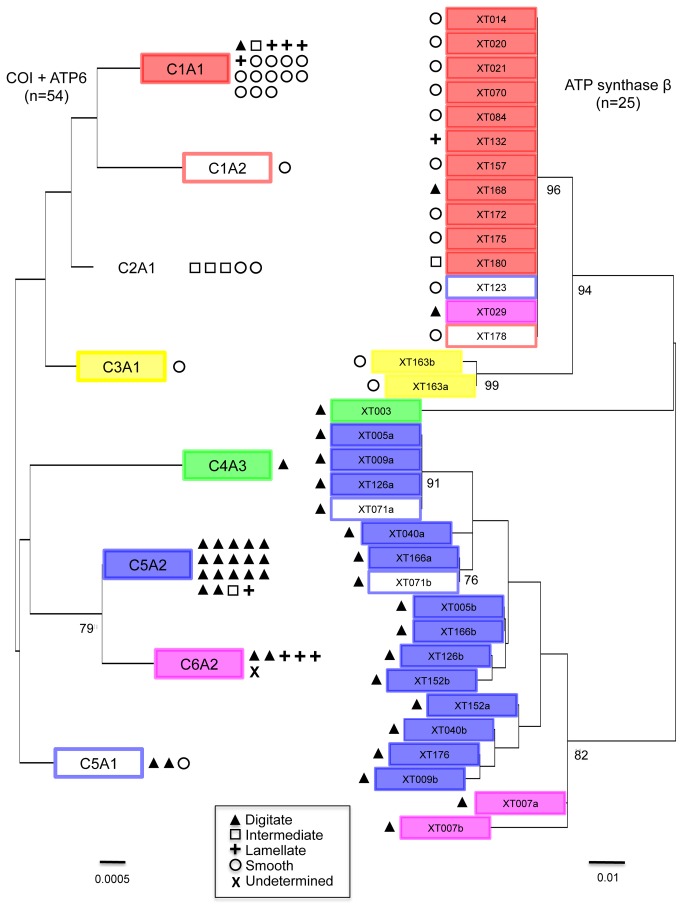
Figure 3. Phylogenetic trees based on mitochondrial and nuclear DNA of Xestospongiatestudinaria .
Unrooted maximum likelihood phylogenetic trees of the combined mitochondrial DNA (CO1+ATP6, n=54, 989 base pairs, left) and nuclear intron ATPSβ (n=34, 258-270 base pairs, right) sequences of Xestospongiatestudinaria . Symbols denote the assigned morphotype of different individuals, with the number of symbols indicating the number of sampled sponges of a given morphotype with that specific DNA sequence (see legend). The colored boxes of the individual sample numbers in the nuclear DNA phylogeny correspond to the same colored boxes of haplotypes in the mitochondrial tree. These colors correspond with the CO1 haplotypes in Figure 2. Haplotypes with an outlined box in a particular color share the CO1 sequence but vary in ATP6 sequence, resulting in a unique combined haplotype (CO1+ATP6). The letters "a" and "b" in the nuclear gene tree represent heterozygote alleles. Bootstrap values are only shown when > 70%. Scale bars depict substitutions per site.

