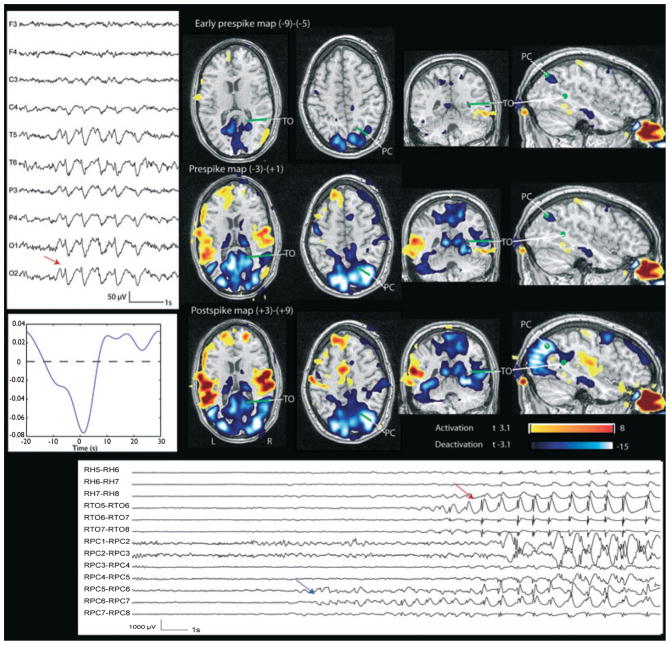
Figure 2.
Patient 2. Right temporal-occipital deactivation and corresponding deactivation in the early prespike and prespike maps. The green points and lines indicate the position of the SEEG contacts visible on this view, obtained by coregistration with the BOLD map. Left: EEG (referential montage) shows burst of sharp waves maximum at O2. Left bottom: HRF. Bottom: SEEG. Red arrow indicates the onset of the interictal event which has a spatial distribution, frequency, and morphology compatible with the scalp EEG events. A discharge involving only the precuneus contacts (RPC6-RPC7, blue arrow) is visible several seconds before it spreads to more superficial and numerous contacts, becoming detectable in the scalp EEG. This focal discharge explains the early BOLD response.
Epilepsia © ILAE

