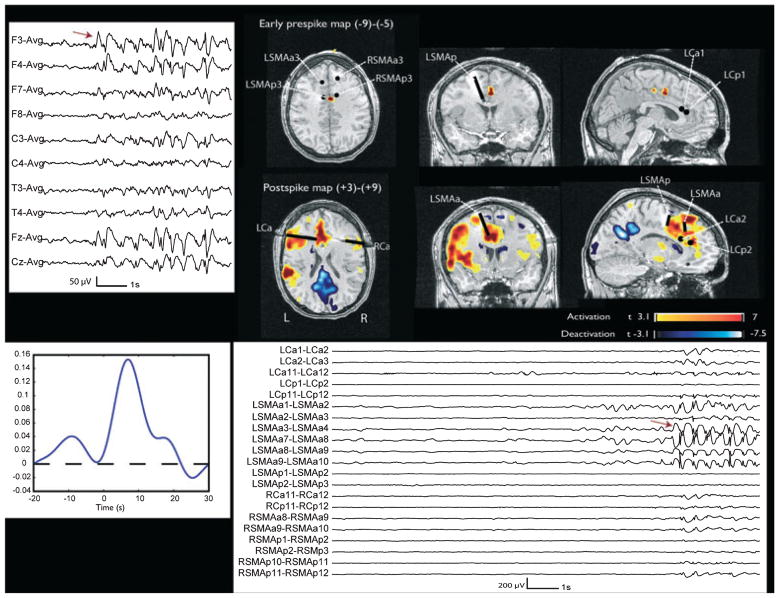
Figure 3.
Patient 3. The early prepsike map shows an activation with maximum between the left and right posterior supplementary motor area (SMA) electrode (deepest contacts). The postspike map shows a left mesial frontal activation, with maximum corresponding to the L SMA anterior electrode and involving also the deepest contacts of the anterior and posterior cingulate electrodes. The black points and lines indicate the electrodes visible in these views and are obtained by coregistration with the BOLD map. Left: EEG (average montage) shows burst of F3, Fz, F4 spikes, maximum on the left. Left bottom: HRF. Bottom: SEEG. Red arrow indicates the onset of the interictal event which has a spatial distribution, frequency and morphology compatible with the scalp EEG events. It is not preceded by any visible change.
Epilepsia © ILAE

