
Figure 3. Changes in body weight and food intake throughout experiment.
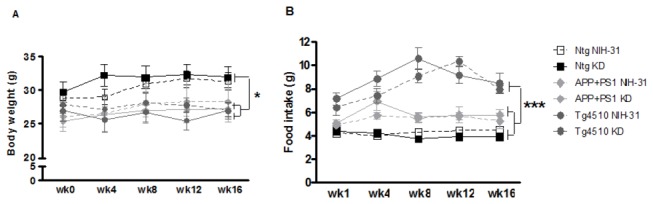
(A) Assessments of body weight and (B) food intake in APP+PS1, Tg4510 and nontransgenic mice on either control diet (NIH-31, open symbols) or ketogenic diet (KD, solid symbols) for 4 months. Both transgenic mouse lines weighed significantly less than nontransgenic mice. (B) Smaller body weights did not result from reductions in food intake. The Tg4510 mice ate significantly more food than did nontransgenic mice. Data are presented as mean ± SEM. *p<0.02, ***p<0.0001.