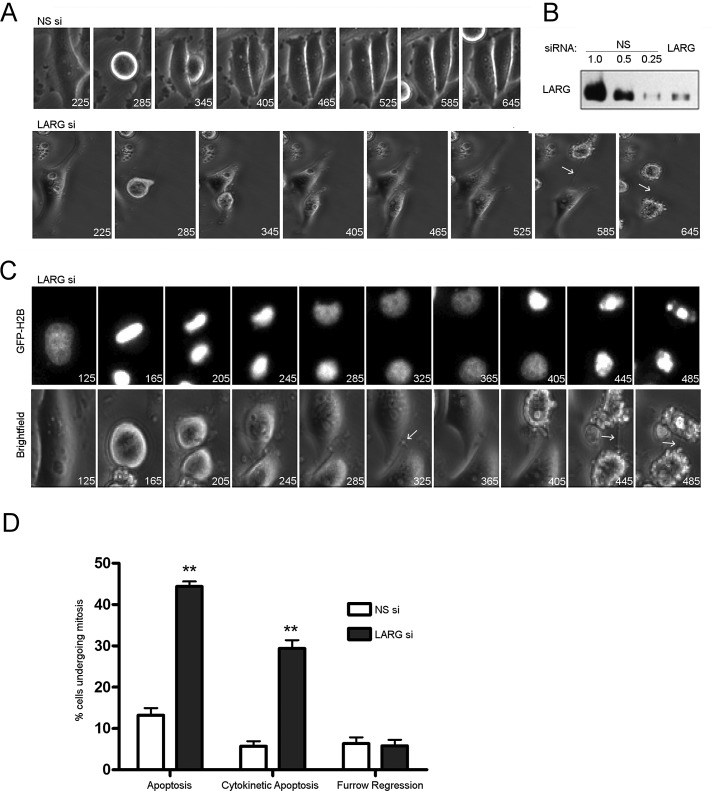
FIGURE 3:
Depletion of LARG results in apoptosis in late cytokinesis. HeLa cells stably expressing GFP-H2B were treated with the indicated siRNA and synchronized at G1/S by the double-thymidine method. Cells were released from G1/S block and imaged by live cell microscopy with times indicated in minutes. (A) Bright-field images of cells progressing through mitosis after treatment with indicated siRNAs. Arrows highlight intercellular bridge in LARG si–treated cells. (B) Representative Western blot of the depletion of LARG in imaged cells. (C) GFP-H2B and bright-field images of LARG si–treated cells showing the classic degradation of DNA and membrane blebbing indicative of apoptosis after unresolved cytokinesis. Arrows highlight intercellular bridges. (D) Quantification of fates of NS and LARG si–treated cells that enter mitosis. Values expressed as a percentage of total number of cells entering mitosis during filming (**p < 0.0005, n = 262 NS si cells, 297 LARG si cells across three independent experiments).

