FIGURE 1:
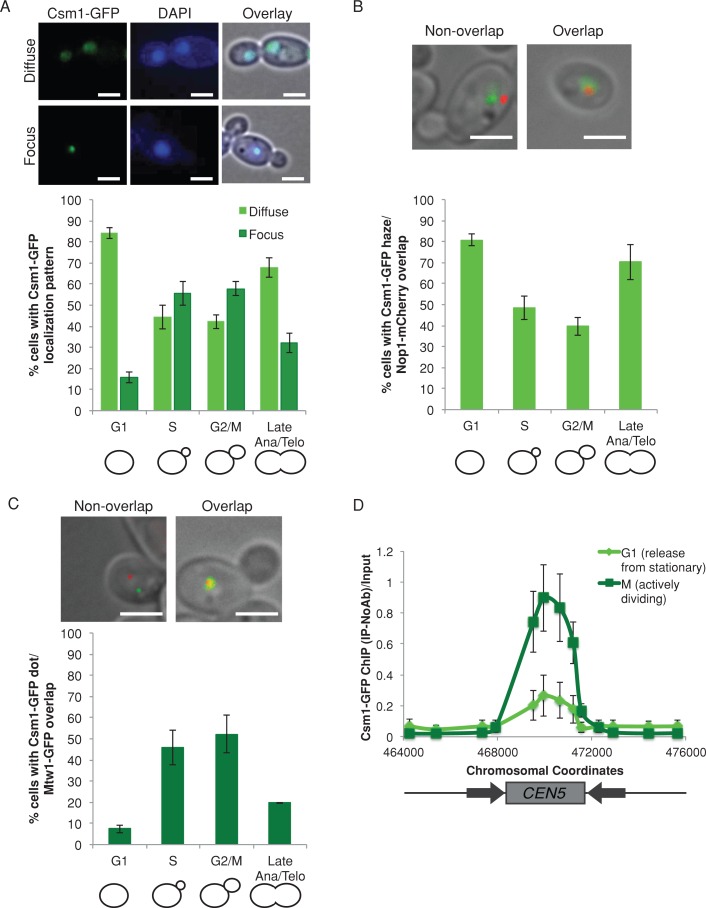
Csm1 colocalizes with kinetochores in actively dividing cells. (A) Csm1-GFP (green) exhibited both diffuse (top) and focal (bottom) localization patterns within DAPI-stained nuclei (blue). Cells were imaged by fluorescence microscopy at 1000× total magnification. The percentage of cells in each cell cycle stage with each localization pattern was quantified. Data shown are mean ± SEM of three biological replicates. Scale bar, 5 μm. (B) Csm1-GFP (green) and Nop1-mCherry (red) were coexpressed and imaged by fluorescence microscopy at 1000× total magnification. The percentage of cells in each cell cycle stage exhibiting colocalization of the Csm1-GFP diffuse region with Nop1-mCherry was quantified. Data shown are mean ± SEM of three biological replicates. Scale bar, 5 μm. (C) Csm1-GFP (green) and Mtw1-mCherry (red) were coexpressed and imaged by fluorescence microscopy at 1000× total magnification. The percentage of cells in each cell cycle stage exhibiting colocalization of the Csm1-GFP focus with Mtw1-mCherry was quantified. Data shown are mean ± SEM of three biological replicates. Scale bar, 5 μm. (D) Anti-GFP ChIP analyzed with primers amplifying CEN5 for a CSM1-GFP strain released from stationary phase into YPA-glucose for 15 min (G1, light green) and 105 min (M, dark green). Data shown are mean ± SEM of three biological replicates.

