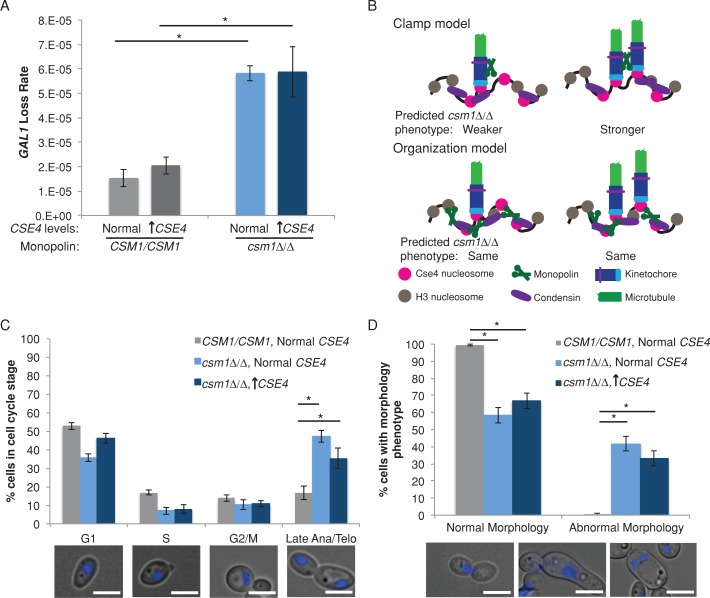
FIGURE 2:
Requirement for CSM1 is not dependent on the number of kinetochore proteins and spindle microtubules in C. albicans. (A) Fluctuation analysis of loss of GAL1 in control and csm1Δ/Δ CSE4/PCK1p-CSE4 strains during growth in repressing conditions (YPA-glucose, normal expression) and activating conditions (YPA-succinate, overexpression). Loss of GAL1 was quantified by plating cells on nonselective media and on media containing 2-DOG. Colony counts were used to calculate the rate of loss per cell division. Results are mean ± SEM of the rates calculated from at least three experiments, each with eight cultures per condition. Significance was determined by analysis of variance (ANOVA) and Tukey posttest. *p < 0.05. (B) Schematic of models for monopolin function. (C) Control strains were grown in SDC-glucose, and csm1Δ/Δ CSE4/PCK1p-CSE4 strains were grown in repressing conditions (SDC-glucose, normal expression) and activating conditions (SDC-succinate, overexpression) for 6 h. Cells were stained with DAPI and imaged at 1000× total magnification with a DAPI filter set. The percentage of cells in each cell cycle stage was determined (bottom, representative cells at each cell cycle stage). Results are mean ± SEM of three biological replicates. Significance was determined by ANOVA and Tukey posttest. *p < 0.01. Scale bar, 5 μm. (D) Cells were grown and imaged as in B. The percentage of cells with abnormal nuclear segregation and/or morphology was determined (bottom, representative abnormal cells of three types: left, lagging DNA segregation; middle, highly elongated, pseudohyphal-like cells; right, multiple nuclei in a single cell). Results are mean ± SEM of three biological replicates. Significance was determined by ANOVA and Tukey posttest. *p < 0.01. Scale bar, 5 μm.

