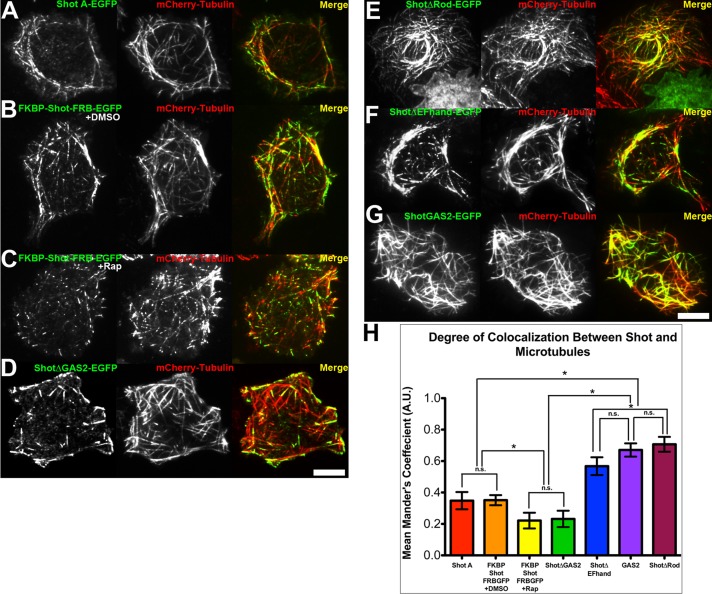
FIGURE 3:
Colocalization between Shot constructs and microtubules. S2 cells cotransfected with (A) Shot A-EGFP, (B) FKBP-Shot-FRB-EGFP treated with DMSO, (C) FKBP-Shot-FRB-EGFP treated with 500 nM rapamycin, (D) Shot∆GAS2-EGFP, (E) Shot∆Rod-EGFP, (F) Shot∆EF-hand-EGFP, and (G) ShotGAS2-EGFP (green) and mCherry-tubulin (red). Scale bar: 10 μm. (H) Graph representing the mean Mander's coefficient quantifying fraction of overlap/colocalization between microtubules and EGFP-tagged Shot constructs. Error bars represent 95% confidence intervals. Statistical analysis was determined by one-way analysis of variance test with Tukey's multiple-comparison post hoc analysis performed on ∼30–40 different cells per condition. Statistical significance is denoted by asterisks (*, p < 0.05), while statistically insignificant comparisons between groups are denoted by n.s.

