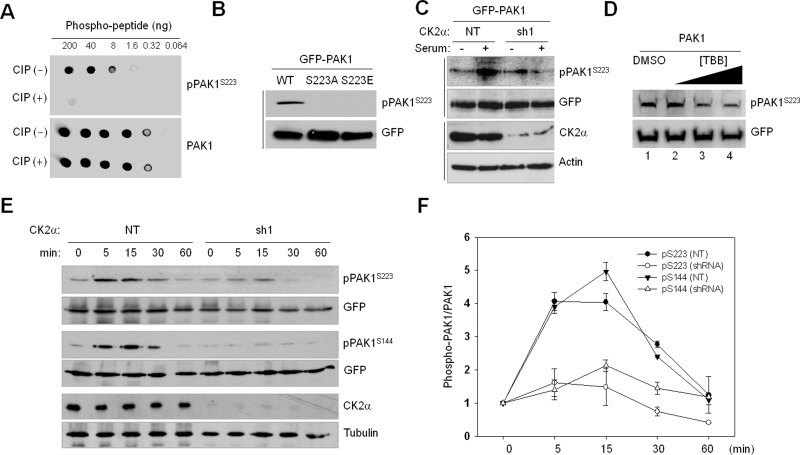
FIGURE 3:
Verification of CK2-dependent PAK1S223 phosphorylation by Western blot analysis using anti-pPAK1S223 antibody. (A) Dot blot analysis of a newly generated phospho-PAK1 (S223) antibody (pPAK1S223). The phospho-PAK1 peptide (214–227; TRDVATSPI-pSer-PTEN) was untreated or treated with calf intestinal phosphatase and incubated with anti-pPAKS223 and anti-PAK1 antibodies. Signals were detected by chemiluminescence detection reagents. (B) Western blot analysis of phosphorylation of S223 of PAK1 (WT), PAK1S223A, and PAK1S223E. (C) GFP-PAK1–expressing 293T cells were treated with (sh1) or without (NT) CK2α knockdown. The cells were incubated for 1 d in the absence of serum and then cultured in the presence (+) or absence (−) of serum for 15 min. Cell lysates were subjected to Western blot analysis with anti-pPAK1S223. (D) Western blot analysis of phosphorylation of PAK1S223 in 293T cells treated with TBB (lane 2: 1 μM; lane 3: 5 μM; lane 4: 20 μM) with anti-pPAK1S223 or anti-GFP antibody. (E) 293T cells with (sh1) or without (NT) CK2α knockdown were infected with lentivirus expressing GFP-PAK1. Cells were incubated for 1 d in the absence of serum and then cultured in the presence of serum for different periods of time, as indicated above each lane, and cell extracts were subjected to Western blot analysis with anti-pPAK1S223 or anti-pPAK1S144 antibody. The same membrane was then stripped and reprobed with anti-PAK1 antibody. (F) Densitometry analysis of results shown in (E). The signals of pPAK1S223 in the immunoblot were quantified by scanning densitometry and normalized to the signals of total GFP-PAK1. Each point represents the mean value of three independent assays, with error bars indicating the SD.

