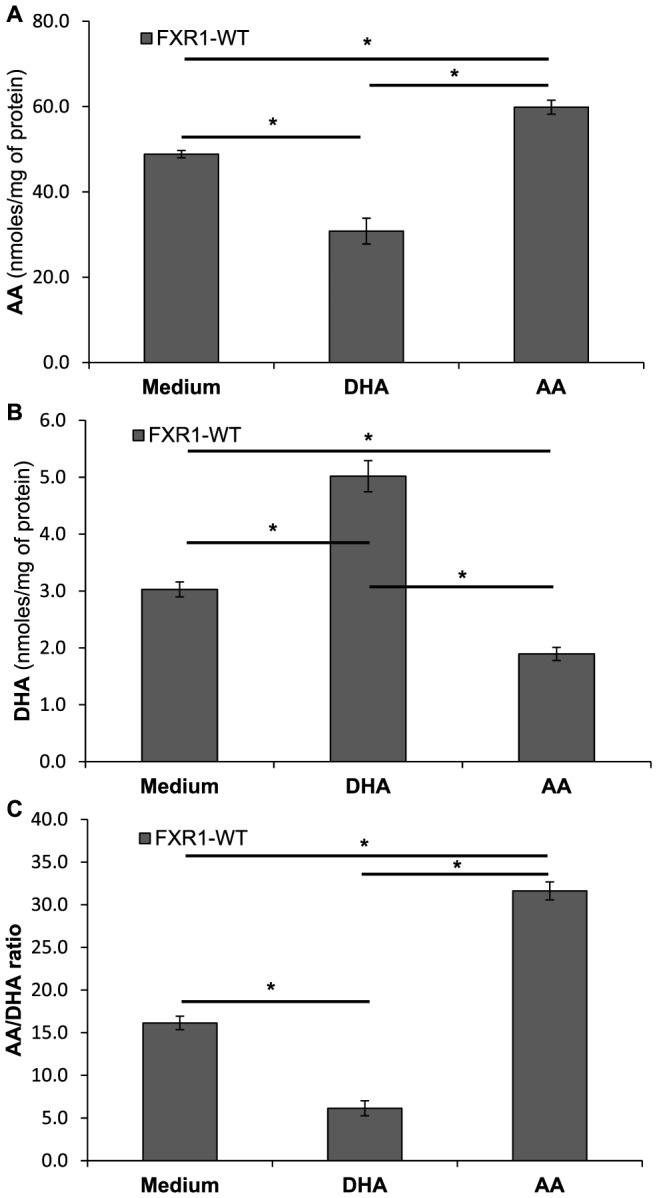
Figure 5. Interactions between AA and DHA in macrophage cell lines stimulated with exogenous AA or DHA.

FXR1-WT (▪) macrophages (50×106 cells) were treated with either arachidonic acid (100 nM) or docosahexaenoic acid (100 nM) for 21 h. Cell were harvested and resuspended in BHA solution. (A) AA levels in FXR1-WT macrophages; (B) DHA levels; (C) AA:DHA ratios. Results are presented as mean ± SEM of four independent experiments. Differences were analyzed by one way ANOVA followed by a Student-Newman-Keuls secondary analysis, and were considered to be significant at p≤0.05. * indicates p<0.05.
