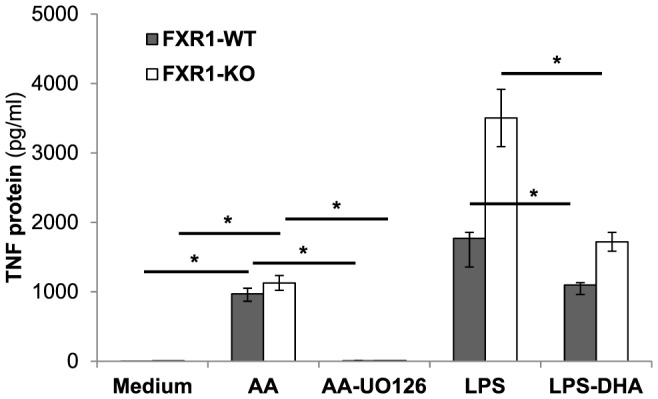
Figure 8. Biological effect of the modulation of ERK1/2 phosphorylation by AA or DHA on TNF gene expression.

FXR1-WT (▪) and FXR1-KO (□) macrophage cell lines (2.5×10⁵ cells) were untreated (Medium) or treated with AA (100 nM) or DHA (100 nM) for 21 h. Cells were also treated with the ERK1/2 inhibitor UO126 (5 µM) concurrently with the AA treatment or stimulated with 50 ng/ml of LPS for 3 h where indicated. Cell supernatants were harvested and levels of TNF were analyzed by ELISA. Results are presented as mean ± SEM of three independent experiments. Differences were analyzed using an unpaired t-test and were considered to be significant at p≤0.05. * indicates p<0.05.
