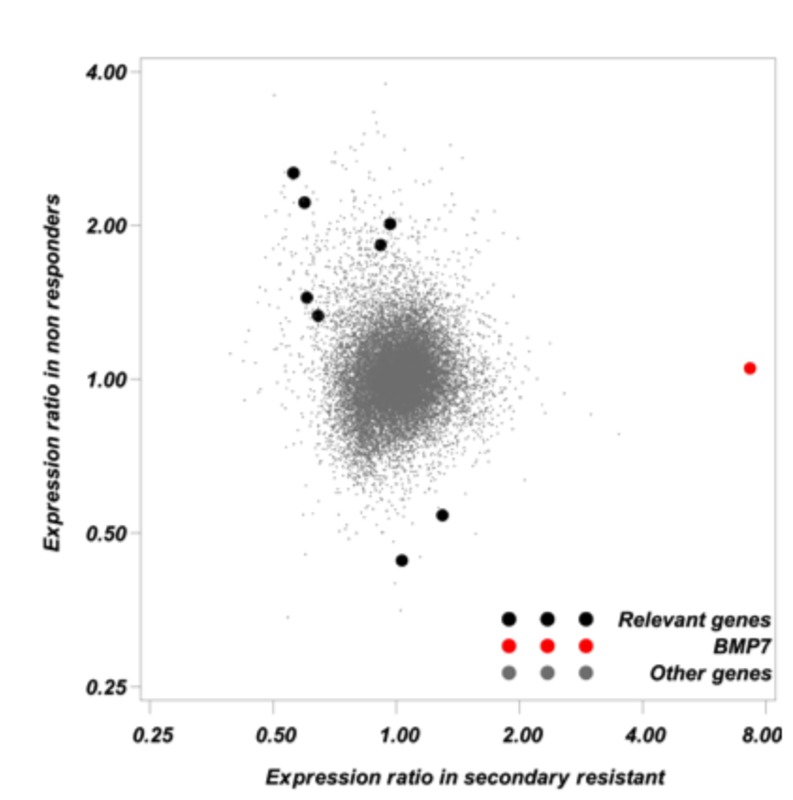
Figure 1. Gene expression ratios were calculated for each gene in primary refractory (non-responders) and in responders (secondary resistant).

Gene expression ratio is equal to the geometric mean gene expression after treatment divided by the geometric mean gene expression before treatment. Gene expression ratios greater than one correspond to increased expression after treatment and conversely. Each point on the figure corresponds to a gene expression ratio in responders according to the expression ratio in non-responders. Nine genes classified as relevant (see methods) are symbolized by black dots. BMP7 which was selected for further investigations is symbolized by a red dot. Small grey symbols were used for “Other genes”.
