
Figure 2. Non-metric multidimensional scaling (NMDS) of Bray-Curtis dissimilarities between the samples, after treatment with four filtering strategies.
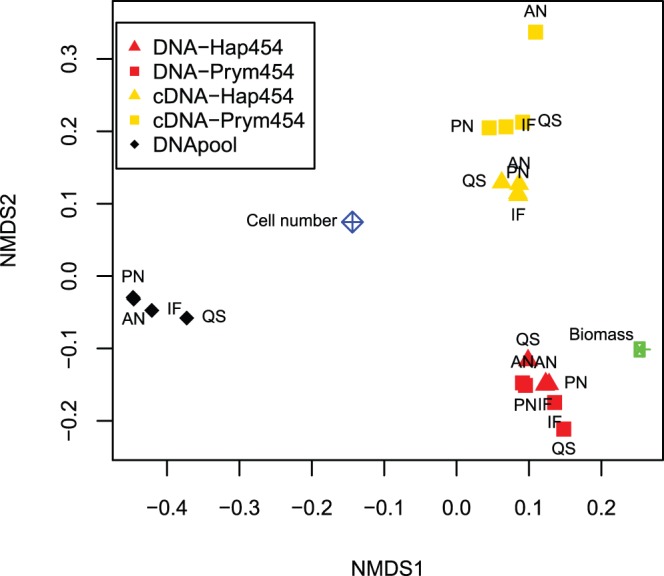
Stress value: 0.04. The green point represents the proportional distribution of species by biomass in the original mixture of cells. The blue point represents the distribution in terms of cell number. Points that cluster together represent similar proportional species distributions. Red: DNA, yellow: RNA/cDNA, Upward triangle: Primer pair Hap454, Square: Primer pair Prym454. Black diamonds represent the pool of equal amounts of DNA from each species, amplified with primer pair Prym454.