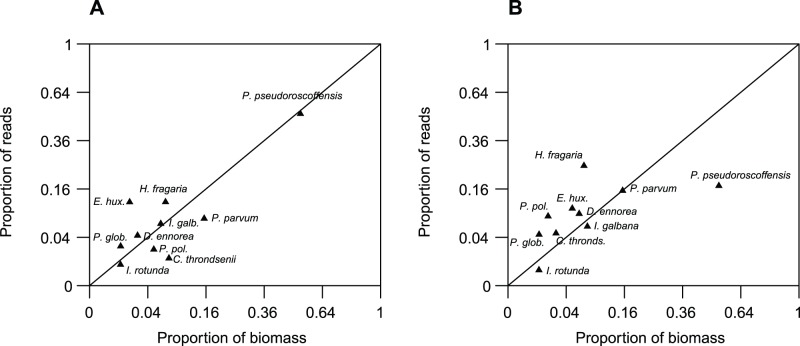
Figure 3. Correlation between proportional species abundance among the reads and the proportional species abundance by biomass in the mock community.
(A) Based on DNA as a template in the PCR, (B) based on RNA/cDNA. The coordinates for each species correspond to the proportional abundance in the biomass (x-axis) and the proportional abundance among the reads (y-axis), after ‘Initial Filtering’-treatment of the reads. The straight line x = y shows the expected proportion of reads based on proportion of biomass. Species that lie below the line are proportionally less abundant in the reads than in the biomass, and vice versa. Note that the axes are scaled by squaring the values to better distinguish between the data points. The correlation between proportional biomass and read abundance with DNA as template was r = 0.94, p<0.001. With cDNA as template the correlation was r = 0.48, p = 0.16. When P. pseudoroscoffensis was omitted from the DNA-values the correlation was not significant (r = 0.24, p = 0.53). The data shown here are obtained with primer pair Hap454. We obtained a similar result with primer pair Prym454 (not shown.). Correlation between the primer pairs was r = 0.99 for DNA, r = 0.93 for cDNA.

