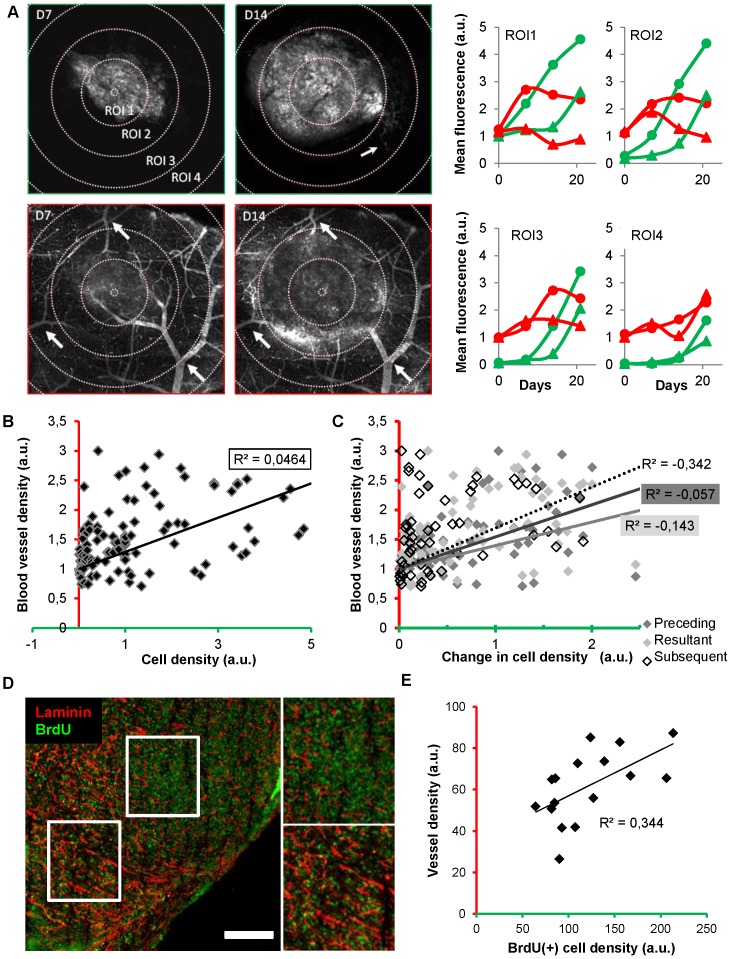
Figure 4. Quantitative analyses and lack of correlation between blood vessel density and tumor cell density.
(A) Green (tumor cells) and red channel (vessel) images of the same plane showing the whole tumor section and its surrounding healthy brain obtained on D7 (day 7) and D14 respectively (depth, 40 µm below the brain surface). Small clusters of tumor cells were detectable (thin arrow in green channel, D14). Stable vascular landmarks (thick arrows in red channel) have been used to register the corresponding 3D image stacks. Initial tumor epicenter was systematically relocated to define 4 conserved circular regions of interests (ROI) (increment, 330 µm) whose mean fluorescence was monitored as an index of tumor cell density or blood supply. Evolutions of the cell density (green) and blood vessel density (red) in the 4 ROIs of two different mice (dots versus triangles). Note that local cell densities and local blood vessel densities are uncorrelated. (B–C) Correlative analysis of the data collected on mice (n = 7) over 4 sessions in 4 ROIs each time (B) Local blood vessel density is poorly correlated with local cell density (R2 = 0.0464). (C) The local changes in cell density ((Dfluo) over time (t2-t1 = Dt)) are also uncorrelated (R2<0) with the initial (t1) (black), resultant (t2) (grey) or subsequent blood vessel density (t3) (dashed line). (D) Immunostaining of vessels (anti-laminin, red) and BrdU positive cells (green) in a section of the whole tumor. White square boxes are enlarged on the right. (E) A poor correlation (R2<0.35) was found between vessel density and cell proliferation quantified from thresholded images of immunostained brain slices (n = 4) taken at D9 from 2 mice. Scale bars, 500 µm.

