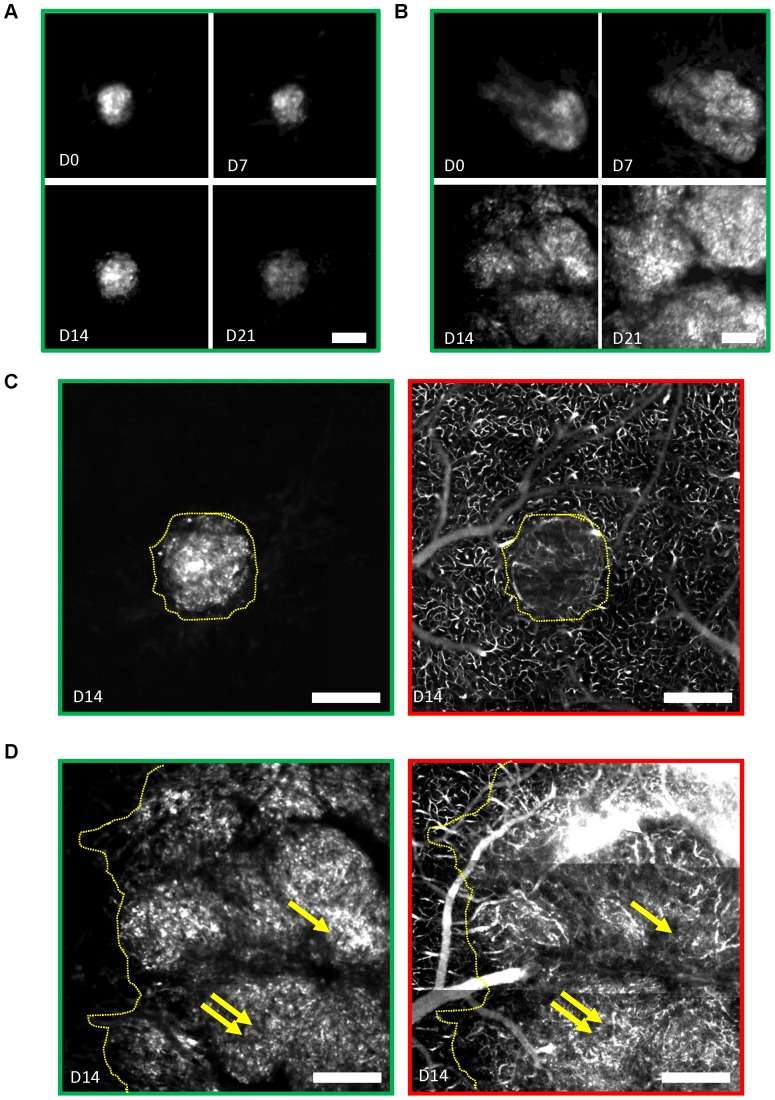
Figure 8. Sensitivity to AMD3100 is heterogeneous and independent of blood vessel density.
(A–B) Mean projection images over a depth of 200 µm showing the evolution of tumor cell densities under AMD3100 (1.25 mg/kg twice daily) treatment in two mice whose tumor burden on D0 were similar (same mean fluorescence intensities within 16%, not shown). Treatment was initiated after the first visualization on D0. After 3 weeks, the tumor cell density was more than 2.5 times larger in B than in A. (C–D) Max intensity projection of the tumor cell densities (green outline) at D14 in a 30 µm section of the tumors presented in A, side by side with the corresponding projection images of the vascular network (red outline). Tumor margins are highlighted with yellow dotted lines. (C) Note the presence of tumor blood vessels compared to a similar size Bev treated tumor completely devoid of blood vessels shown in Figure 6C . (D) Dense tumor vascularization is even more obvious in the larger tumor. The highest vascular densities (double arrows) are not correlated with the highest tumor densities (single arrow). Scale bars, 400 µm.

