
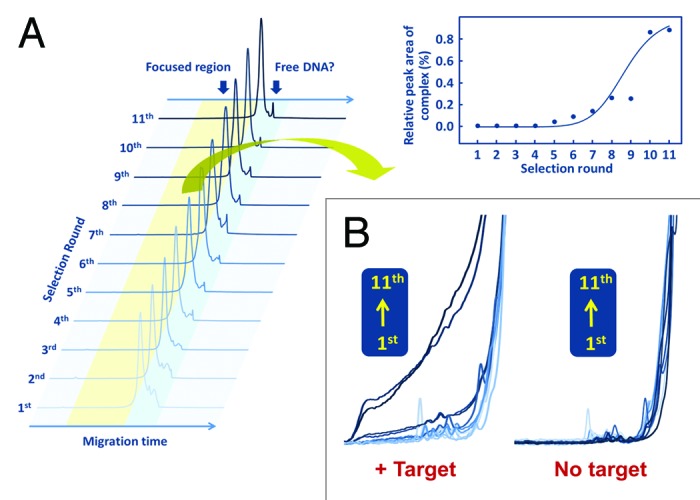
Figure 8. Process of active species enrichment in selection rounds. (A) Capillary electrograms for library E of each round with human thrombin (left graphic). All electrograms recorded fluorescent intensity of 5′-labeled 6-FAM vs. migration time. Saturation curve of library enrichment for TBA acquisition (right graphic). (B) Enlarged and overlapped view of each round of capillary electrograms with or without human thrombin.