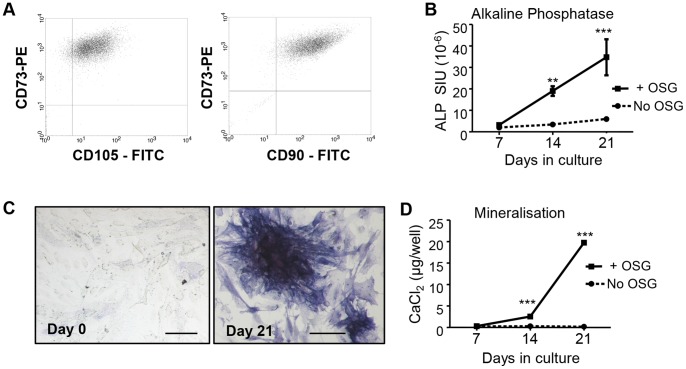
Figure 2. Characterisation of MSCs and their differentiation.
(A) FACS analysis of expanded adipose stromal cells in culture revealed a high proportion of cells expressing CD90, CD73 and CD105, indicating a population enriched in MSC; PE = phycoerythrin label, FITC = fluoroscein isothiocyanate label. To assess their osteogenic capacity, cells were cultured in medium with or without osteogenic factors (OSG; ascorbate, dexamethasone and β-glycerophosphate) for 7, 14 and 21 days and assessed (B) for ALP activity; (C) Photomicrograph ALP histochemical staining of MSC cultures after 0 and 21 days of OSG stimulus, the latter showing clusters of strongly ALP positive (blue) cells; bars = 100 µm. (D) The ability of the cells to form mineralised matrix was determined by Alizarin Red binding assay. Data displayed as mean ± SEM with statistical significance determined by two-way ANOVA, General Linear Model, and Tukey's post hoc test, n = 6, **p≤0.01, ***p≤0.001 relative to respective (no OSG) controls.

