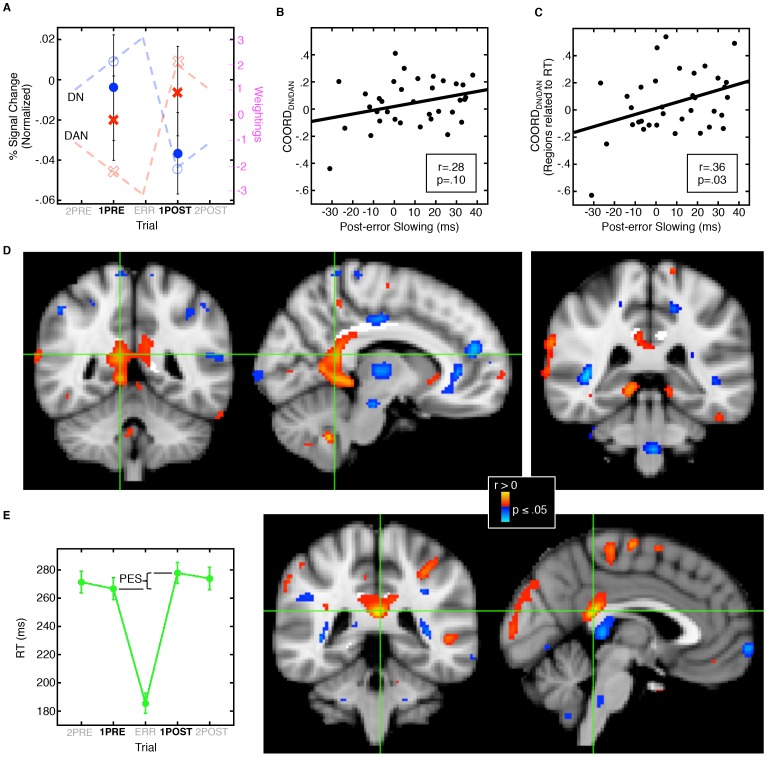
Figure 3. Relations of network coordination, post-error slowing, and the microstructural integrity of the posterior cingulum bundle.
A: The ‘index of network coordination’ quantifies the magnitude of the reciprocal change in default relative to dorsal attention network activation from trial position 1PRE to 1POST. Dashed lines show integer weightings representing predictions for network activation across trial position, red for the dorsal attention network (DAN) and blue for the default network (DN). Open symbols (circles and x’s) are expected activation values at trials 1PRE and 1POST. Filled symbols represent means of activation with standard errors at these positions. For display purposes only, activation values were normalized based on the mean activation across all five trial positions. B: Correlation of network coordination (COORDDN/DAN), and post-error slowing. C: Same correlation as B, but with the definition of COORDDN/DAN restricted to network regions in which activation correlated with RT (see Fig. 2A–C). D: Statistical maps of correlations of FA with COORDDN/DAN displayed on the MNI152 template brain. The posterior cingulum bundle ROI is highlighted in white. Warm and cool colors indicate positive and negative correlations, respectively. Crosshairs in the left and middle images show coronal and sagittal views of the voxel of maximal significance (MNI coordinates: 10, −48, 16). The right image shows that the region of correlation extends along the cingulum bundle to its termination in the parahippocampal gyrus. E: Plot of mean RT across trial position with standard error bars (left) indicating the measurement of post-error slowing (PES). PES was defined as the difference in RT between 1POST and 1PRE. Statistical maps of correlations of FA with post-error slowing (right; peak MNI coordinates: −2, −40, 20).

