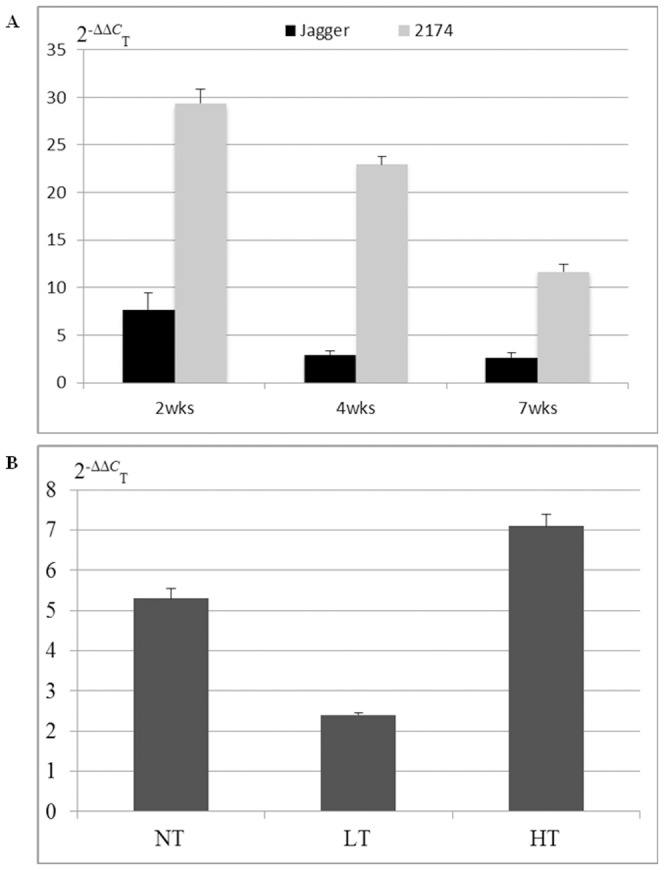
Figure 7. Expression profiles of TaMFT-A1.

A) Transcript levels of TaMFT-A1a (the Jagger allele) and TaMFT-A1b (the 2174 allele) in the after-ripened seeds. RNA samples were collected from embryos of seeds, when the seeds were tested at 2 weeks (2 wks), 4 weeks (4 wks), and 7 weeks (7 wks) after harvest. B) Regulation of TaMFT-A1 transcript levels by temperature. The RNA samples were collected from 2174 seeds that were treated with normal temperature (NT, 25°C), low temperature (LT, 4°C) for overnight, and high temperature (HT, 37°C) for 5 days. Transcript levels are shown using the values calculated by the 2(−ΔΔCT) method, where CT is the threshold cycle, and actin was used as an endogenous control. The values represent mean expression levels (n = 12), and the bar indicates standard error.
