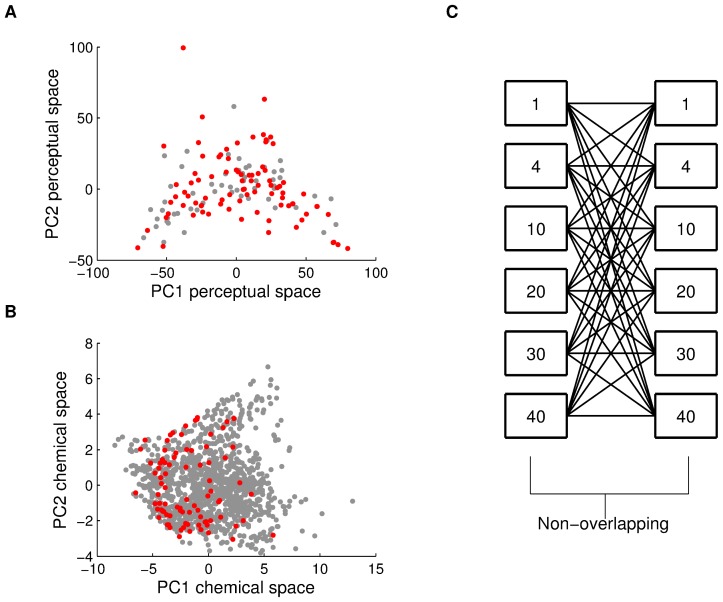
Figure 1. Odorant selection and comparison.
The odorants we used are plotted in red, presented within: (A) Perceptual space: 138 odorants commonly used in olfaction research, projected onto a two-dimensional space of PC1 (30.8% of the variance) and PC2 (12% of the variance) of perception. (B) Physicochemical space: 1358 odorants commonly modeled in olfaction research projected onto a two-dimensional space made of PC1 (37.7% of the variance) and PC2 (12.5% of the variance) of structure. (C) A schematic reflecting mixture comparisons in Dataset #1 in Table S2. Each mixture was compared to all other mixtures with zero overlap in component identity, and to itself. Note that this schematic reflects one quarter of the data, as we had eight versions of each mixture size.

