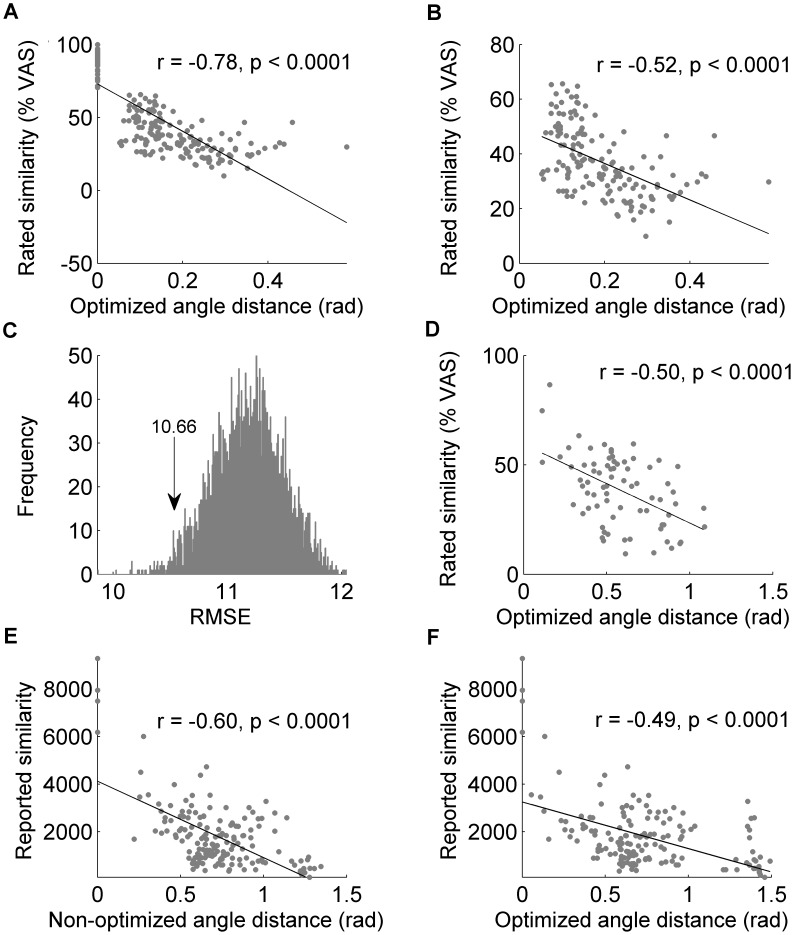
Figure 6. Performance of the optimized angle distance model on independent data.
(A) Performance of the optimized model on complete Dataset #1 in Table S2. Each dot reflects a comparison between two mixtures. (B) The same as in panel A after omitting comparisons of mixtures to themselves. (C) RMSE histogram reflecting the performance of random selections of 21 descriptors. The optimized selection was at an RMSE of 10.66, which is better than 95.30% of the randomly selected sets. (D) Performance of the optimized angle distance model on mono-molecules (Dataset #3 in Table S2). (E) Performance of the angle distance model on mono-molecules tested 50 years ago independently by others [28]. (F) Performance of the optimized angle distance model on the data in panel E. Each dot reflects a comparison between two mono-molecules.

