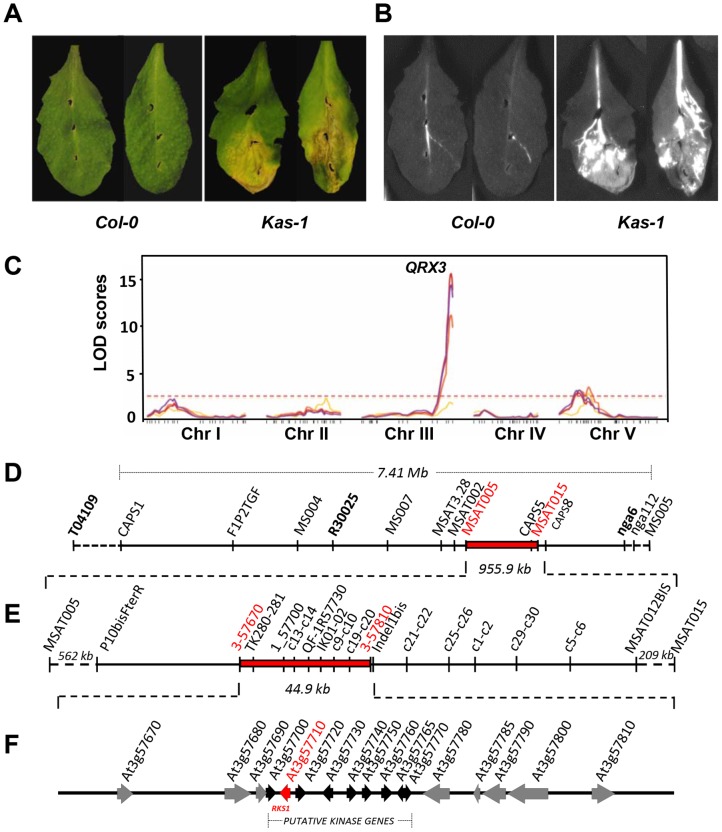
Figure 1. Identification and mapping of the major QTL, QRX3, for resistance to Xcc.
(A and B) Phenotype of susceptible (Kas-1) and resistant (Col-0) accessions (Col-5 and Col-0 (used here) show similar phenotypes) : (A) symptoms 7 days post-inoculation (dpi) and (B) bacterial invasion of leaf tissue using an Xcc568 reporter strain that carries the Photorhabdus luminescens lux operon. (C) QTL maps of resistance to Xcc in the Col-5 x Kas-1 recombinant inbred line population at four inoculation times: yellow, 3 dpi; orange, 5 dpi; red, 7 dpi and purple, 10 dpi. The horizontal dotted line represents the significance threshold for the LOD score (average = 2.50). (D to F) Map-based isolation of the QRX3 locus. (D) Genetic map of chromosome III is shown between markers T04109 and MS005 with the defined target interval for QRX3 (in red). (E) A number of additional markers and recombinant lines were used to reduce the QRX3 locus to a 44.9 kb region between the markers 3-57670 and 3-57810. (F) The corresponding physical interval contains 17 open reading frames (ORFs). Genes are represented by arrows. The black arrows correspond to a cluster of putative kinase genes, the red arrow corresponds to RKS1.

