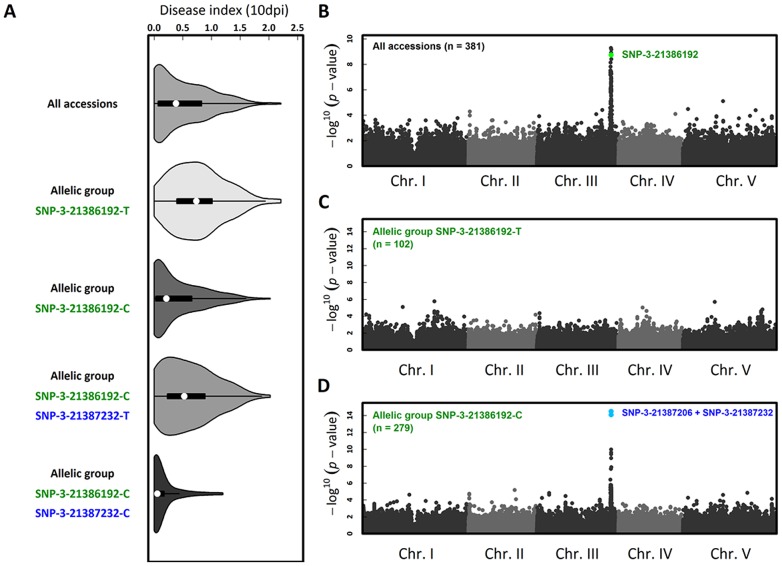
Figure 6. The genetics of Xcc568 quantitative resistance at the species level identified by nested GWA mapping.
(A) Violin plots (i.e. box-and-whisker plot overlaid with a kernel density plot) of phenotypic variation of our disease index. Whole-genome scan of 214,051 SNPs for association with disease index at 10 dpi across (B) 381 accessions, (C) within the allelic group SNP-3-21386192-T and (D) within the allelic group SNP-3-21386192-C.

